Select units of measurement for the temperature and rainfall tables (metric or imperial).
Average weather, temperature, rainfall, sunshine hours

The climate of Livorno (or Leghorn) is
Mediterranean, with mild, rainy winters and warm, sunny summers.
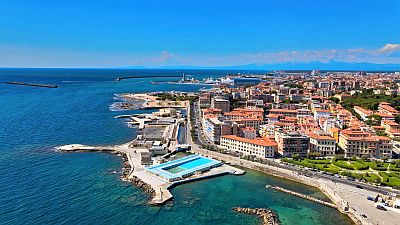
The city is located in Tuscany, on the coast of the Ligurian Sea, about 15 km (9 mi) southwest of Pisa. About 35 km (21.5 mi) southwest of the coast is the small island of Gorgona. On the coast are: Marina di Pisa and Tirrenia to the north, and Rosignano Solvay and Cecina to the south.
Just east of the city are the Livorno Hills, which reach 462 meters (1,515 feet) in Poggio Lecceta.
Winter, from December to February, is mild, with sunny periods but also periods of bad weather.
Snow in Livorno is rare, however, during the most intense cold spells, snow can occasionally occur. Snow with accumulation occurred in February 1956, January 1985, February 1991, December 2010, and February 2012. On this last occasion, 15-20 cm (6-8 in) fell on the coast. On the hills near the city, snowfalls are naturally more frequent and abundant.
Typically, the temperature drops slightly below freezing on the coldest nights, however, in January 1985 it reached -7 °C (19.5 °F).
 Summer
, from June to August, is warm to hot and sunny.
Some weather disturbances may pass over the city even in summer, especially in June and in late August, while on sunny days, some thunderstorms may reach the coast after forming in the interior.
Generally, the heat is not excessive because of the sea breeze, but we cannot exclude some particularly sultry periods, with highs of 32/33 °C (90/91 °F). In August 2003, the temperature reached 37 °C (97 °F).
Best Time
The
best times to visit Livorno are spring and early summer, in particular, from mid-April to mid-June. September, too, is a good month, especially in the first half, while later, Atlantic depressions become more frequent.
In the height of summer, in July and August, it can be hot, although less frequently than in other parts of Italy.
For a beach holiday, the best months are exactly July and August.
Livorno - Climate data
In Livorno, the
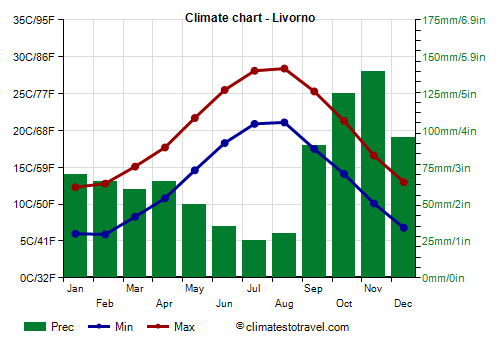
average temperature of the coldest month (January) is of
9.2 °C, that of the warmest month (August) is of
24.8 °C. Here are the average temperatures.
Livorno - Average temperatures (1991-2020) |
| Month | Min | Max | Mean |
|---|
| January | 6 | 12.3 | 9.2 |
|---|
| February | 5.9 | 12.8 | 9.4 |
|---|
| March | 8.3 | 15.1 | 11.7 |
|---|
| April | 10.8 | 17.7 | 14.2 |
|---|
| May | 14.6 | 21.7 | 18.2 |
|---|
| June | 18.3 | 25.5 | 21.9 |
|---|
| July | 20.9 | 28.1 | 24.5 |
|---|
| August | 21.1 | 28.4 | 24.8 |
|---|
| September | 17.5 | 25.3 | 21.4 |
|---|
| October | 14.1 | 21.3 | 17.7 |
|---|
| November | 10.1 | 16.6 | 13.4 |
|---|
| December | 6.8 | 13 | 9.9 |
|---|
| Year | 12.9 | 19.9 | 16.35 |
|---|
amounts to
840 millimeters per year: so, it is at an intermediate level. It ranges from
25 millimeters in the driest month (July) to
140 millimeters in the wettest one (November). Here is the average precipitation.
Livorno - Average precipitation| Month | Days |
|---|
| January | 70 | 8 |
|---|
| February | 65 | 7 |
|---|
| March | 60 | 6 |
|---|
| April | 65 | 7 |
|---|
| May | 50 | 5 |
|---|
| June | 35 | 4 |
|---|
| July | 25 | 2 |
|---|
| August | 30 | 3 |
|---|
| September | 90 | 6 |
|---|
| October | 125 | 9 |
|---|
| November | 140 | 10 |
|---|
| December | 95 | 10 |
|---|
| Year | 840 | 75 |
|---|
The
sea temperature ranges from
13.5 °C in January, February, March to
25 °C in August. Here are the average sea temperatures.
Livorno - Sea temperature| Month |
|---|
| January | 13.5 |
|---|
| February | 13.5 |
|---|
| March | 13.5 |
|---|
| April | 15 |
|---|
| May | 18 |
|---|
| June | 21 |
|---|
| July | 24 |
|---|
| August | 25 |
|---|
| September | 22.5 |
|---|
| October | 20 |
|---|
| November | 17.5"> |
|---|
| December | 15 |
|---|
| Year | 18.3 |
|---|
There are on average around 2460
sunshine hours per year. Here are the average hours of sunshine per day.
Livorno - Sunshine hours| Month | Average | Total |
|---|
| January | 4 | 125 |
|---|
| February | 4.5 | 135 |
|---|
| March | 5.5 | 165 |
|---|
| April | 7 | 205 |
|---|
| May | 8 | 255 |
|---|
| June | 9.5 | 285 |
|---|
| July | 11 | 335 |
|---|
| August | 9.5 | 300 |
|---|
| September | 8 | 235 |
|---|
| October | 6 | 190 |
|---|
| November | 4 | 125 |
|---|
| December | 3.5 | 110 |
|---|
| Year | 6.7 | 2460 |
|---|