Select units of measurement for the temperature and rainfall tables (metric or imperial).
Average weather, temperature, rainfall, sunshine hours

In La Maddalena, the climate is
Mediterranean, with mild, rainy winters and hot, sunny summers.
As in the rest of Sardinia, both the mistral (cool, dry wind from the north-west) and the sirocco (warm, humid wind from the south-east) can blow.
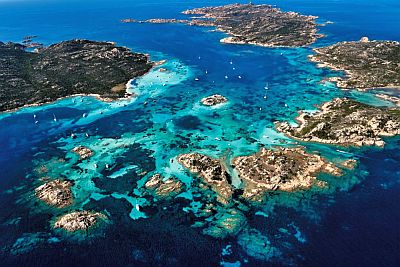
The island of La Maddalena is the main island of the homonymous archipelago, protected in a national park, and is located near the north coast of Sardinia. Nearby is the island of
Caprera, connected by a bridge.
We are in the area of the
Strait of Bonifacio, which separates Sardinia and Corsica and is very windy.
In winter, the temperature very rarely drops below freezing. The record is -2.6 °C (27.3 °F), but it dates back to 1963.
In summer, when the sirocco blows, it can get very hot. The heat records is 39.8 °C (103.6 °F), set in July 2023.

Best Time
The best months for a
beach holiday are July and August. In June, the days are longer and the weather is often good, but the sea is still a bit cool. You can still go in September, in fact the sea is still quite warm, but the days get shorter and the first waves of bad weather can occur, especially in the second half of the month.
La Maddalena - Climate data
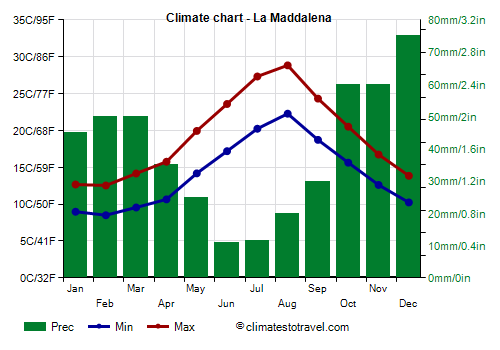
In La Maddalena, the
average temperature of the coldest month (February) is of
10.5 °C, that of the warmest month (August) is of
25.6 °C. Here are the average temperatures.
La Maddalena - Average temperatures (1991-2002) |
| Month | Min | Max | Mean |
|---|
| January | 9 | 12.7 | 10.8 |
|---|
| February | 8.5 | 12.5 | 10.5 |
|---|
| March | 9.6 | 14.2 | 11.9 |
|---|
| April | 10.7 | 15.8 | 13.2 |
|---|
| May | 14.2 | 19.9 | 17.1 |
|---|
| June | 17.2 | 23.6 | 20.4 |
|---|
| July | 20.2 | 27.3 | 23.8 |
|---|
| August | 22.3 | 28.8 | 25.6 |
|---|
| September | 18.7 | 24.3 | 21.5 |
|---|
| October | 15.6 | 20.5 | 18.1 |
|---|
| November | 12.6 | 16.7 | 14.7 |
|---|
| December | 10.2 | 13.9 | 12 |
|---|
| Year | 14.1 | 19.2 | 16.65 |
|---|
amounts to
470 millimeters per year: it is therefore quite scarce. It ranges from
11.1 millimeters in the driest month (June) to
75 millimeters in the wettest one (December). Here is the average precipitation.
La Maddalena - Average precipitation| Month | Days |
|---|
| January | 45 | 7 |
|---|
| February | 50 | 7 |
|---|
| March | 50 | 7 |
|---|
| April | 35 | 5 |
|---|
| May | 25 | 4 |
|---|
| June | 11 | 2 |
|---|
| July | 12 | 1 |
|---|
| August | 20 | 2 |
|---|
| September | 30 | 4 |
|---|
| October | 60 | 6 |
|---|
| November | 60 | 8 |
|---|
| December | 75 | 8 |
|---|
| Year | 470 | 61 |
|---|
The
sea temperature ranges from
13.5 °C in February to
25 °C in August. Here are the average sea temperatures.
La Maddalena - Sea temperature| Month |
|---|
| January | 14 |
|---|
| February | 13.5 |
|---|
| March | 14 |
|---|
| April | 15 |
|---|
| May | 17.5 |
|---|
| June | 21 |
|---|
| July | 24 |
|---|
| August | 25 |
|---|
| September | 23.5 |
|---|
| October | 21 |
|---|
| November | 18"> |
|---|
| December | 15.5 |
|---|
| Year | 18.6 |
|---|