Select units of measurement for the temperature and rainfall tables (metric or imperial).
Average weather, temperature, rainfall, sunshine hours

In Forlì, there is a
semi-continental climate. Winters are quite cold and damp, while summers are hot and muggy.
The city is located in northern Italy, in Romagna, 25 kilometers (15 miles) away from the coast of the Adriatic Sea and at 44 degrees north latitude. A short distance to the southwest, the first hills of the Tuscan-Emilian Apennines begin.
This area is a little milder than the Po Valley, however it is exposed to the cold
bora wind, which blows in gusts from the plains of Eastern Europe, especially in the cold half year. On the other hand,
warm winds can blow, the sirocco from the southeast and the garbino, the wind from the Apennines, from the southwest.

In
winter, from December to February, there can be cold, gray and foggy periods, throughout less often than in Emilia. However, the wind can increase the feeling of cold, especially when the
Bora blows.
Snow in Forlì is less frequent than in Bologna and in the cities of western Emilia. However, an average of almost 25 cm (10 in) of snow falls per year. Occasionally, snowfalls can be abundant, given the geographical situation, with the wind that comes from the sea and then meets the Apennines. In February 2012, a total of 160 cm (63 in) of snow fell, while 195 cm (77 in) fell in the nearby city of Cesena. Probably, these are record levels for a lowland city in Europe.
During
cold spells, which are becoming rarer due to global warming, the temperature can drop to -10 °C (14 °F) or below. In January 1985 it dropped to -18.5 °C (-1.5 °F).
The
summer, from June to August, is hot and muggy, and generally sunny. The breeze from the sea makes the heat more bearable than in the cities of Emilia.
However, sometimes it can get very hot, especially when the wind blows from the south. In July 1983 and July 2022, the temperature reached 40 °C (104 °F), while in August 2017 it even reached 43 °C (109.5 °F), although there are doubts about this last figure.
Sometimes there may be some rainy days even in summer, or thunderstorms may break out in the afternoon or in the evening.
Best Time
The
best times to visit Forlì are spring and early summer, particularly from mid-April to mid-June. September is also a good month. However, some rainy days must be taken into account in both periods.
Summer can be very hot, although it can give some acceptable days, especially in June. You have to take into account, in summer and sometimes in May, some afternoon or evening thunderstorms.
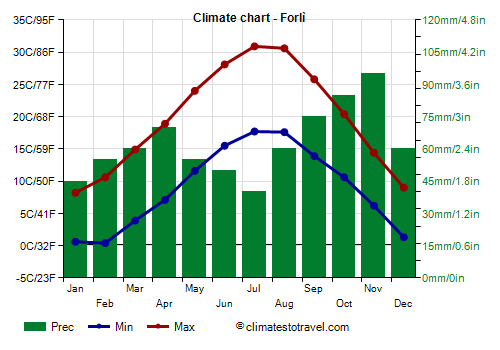
Forlì - Climate data
In Forlì, the
average temperature of the coldest month (January) is of
4.4 °C, that of the warmest month (July) is of
24.3 °C. Here are the average temperatures.
Forlì - Average temperatures (2000-2014) |
| Month | Min | Max | Mean |
|---|
| January | 0.6 | 8.2 | 4.4 |
|---|
| February | 0.4 | 10.6 | 5.5 |
|---|
| March | 3.9 | 14.9 | 9.4 |
|---|
| April | 7.1 | 18.9 | 13 |
|---|
| May | 11.6 | 24 | 17.8 |
|---|
| June | 15.5 | 28.1 | 21.8 |
|---|
| July | 17.7 | 30.9 | 24.3 |
|---|
| August | 17.6 | 30.6 | 24.1 |
|---|
| September | 13.9 | 25.8 | 19.8 |
|---|
| October | 10.6 | 20.4 | 15.5 |
|---|
| November | 6.2 | 14.4 | 10.3 |
|---|
| December | 1.3 | 9 | 5.2 |
|---|
| Year | 8.9 | 19.7 | 14.25 |
|---|
amounts to
755 millimeters per year: so, it is at an intermediate level. It ranges from
40 millimeters in the driest month (July) to
95 millimeters in the wettest one (November). Here is the average precipitation.
Forlì - Average precipitation| Month | Days |
|---|
| January | 45 | 6 |
|---|
| February | 55 | 6 |
|---|
| March | 60 | 7 |
|---|
| April | 70 | 8 |
|---|
| May | 55 | 6 |
|---|
| June | 50 | 5 |
|---|
| July | 40 | 4 |
|---|
| August | 60 | 5 |
|---|
| September | 75 | 7 |
|---|
| October | 85 | 8 |
|---|
| November | 95 | 9 |
|---|
| December | 60 | 8 |
|---|
| Year | 755 | 79 |
|---|
There are on average around 2285
sunshine hours per year. Here are the average hours of sunshine per day.
Forlì - Sunshine hours| Month | Average | Total |
|---|
| January | 3 | 95 |
|---|
| February | 4 | 110 |
|---|
| March | 5 | 160 |
|---|
| April | 6 | 185 |
|---|
| May | 8 | 250 |
|---|
| June | 9.5 | 280 |
|---|
| July | 10.5 | 325 |
|---|
| August | 9.5 | 300 |
|---|
| September | 7.5 | 230 |
|---|
| October | 5.5 | 165 |
|---|
| November | 3 | 95 |
|---|
| December | 2.5 | 85 |
|---|
| Year | 6.3 | 2285 |
|---|