Select units of measurement for the temperature and rainfall tables (metric or imperial).
Average weather, temperature, rainfall, sunshine hours

The climate of Crotone is
Mediterranean, with mild, relatively rainy winters and hot, sunny summers.
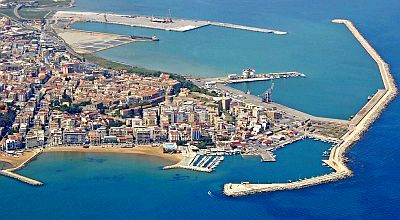
The city is located in southern Italy, in the Calabria region, on the coast of the Ionian Sea, near the easternmost point of the region (Capo Colonna).
Winter, from December to February, is mild, and is characterized by sunny periods alternating with rainy periods.
Despite the mild climate, given the position on the Ionian side, there can sometimes be
cold and windy periods, generally of short duration, with highs of around 5 °C (41 °F), and during which there may even be a light snowfall or rain mixed with snow.
However, to see the beaches covered with snow, you have to wait several years. For example, this happened in December 1991 and December 2001.
Generally, the temperature drops to a minimum of -2 °C (28 °F) during cold spells, although in the past, at the Isola Capo Rizzuto airport, it dropped to lower values: in February 1956 it dropped to -7.7 °C (18 °F), while in January 1979 it dropped to -6.2 °C (20.8 °F).
 Summer
, from June to August, is hot and sunny, with the sea breeze blowing regularly in the afternoon and with rare rains.
During
heat waves of African origin, the temperature can reach, and sometimes exceed, 40 °C (104 °F). The records from June to August are 42/43 °C (108/109 °F).
Best Time
To visit Crotone, you can choose the periods from mid-April to mid-May and from mid-September to mid-October, since in summer it can get very hot. It must be said that in both periods there may be rainy days.
The best months for a beach holiday on the coast are July and August. In June, the days are long and the weather is often good, but the sea is still a bit cool. You can still go in September, in fact the sea is still quite warm, but the days get shorter and the first waves of bad weather can occur, especially in the second half of the month.
Crotone - Climate data
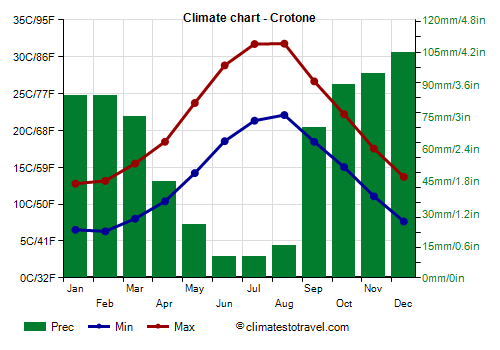
In Crotone, the
average temperature of the coldest month (January) is of
9.7 °C, that of the warmest month (August) is of
26.9 °C. Here are the average temperatures.
Crotone - Average temperatures (1991-2018) |
| Month | Min | Max | Mean |
|---|
| January | 6.5 | 12.8 | 9.7 |
|---|
| February | 6.3 | 13.2 | 9.7 |
|---|
| March | 8 | 15.5 | 11.8 |
|---|
| April | 10.4 | 18.5 | 14.4 |
|---|
| May | 14.2 | 23.7 | 19 |
|---|
| June | 18.6 | 28.8 | 23.7 |
|---|
| July | 21.3 | 31.7 | 26.5 |
|---|
| August | 22.1 | 31.8 | 26.9 |
|---|
| September | 18.5 | 26.7 | 22.6 |
|---|
| October | 15 | 22.2 | 18.6 |
|---|
| November | 11.1 | 17.5 | 14.3 |
|---|
| December | 7.7 | 13.7 | 10.7 |
|---|
| Year | 13.4 | 21.4 | 17.35 |
|---|
amounts to
705 millimeters per year: so, it is at an intermediate level. It ranges from
10 millimeters in the driest months (June, July) to
105 millimeters in the wettest one (December). Here is the average precipitation.
Crotone - Average precipitation| Month | Days |
|---|
| January | 85 | 7 |
|---|
| February | 85 | 7 |
|---|
| March | 75 | 7 |
|---|
| April | 45 | 5 |
|---|
| May | 25 | 3 |
|---|
| June | 10 | 2 |
|---|
| July | 10 | 2 |
|---|
| August | 15 | 2 |
|---|
| September | 70 | 5 |
|---|
| October | 90 | 6 |
|---|
| November | 95 | 7 |
|---|
| December | 105 | 8 |
|---|
| Year | 705 | 61 |
|---|
The
sea temperature ranges from
14.5 °C in February, March to
26 °C in August. Here are the average sea temperatures.
Crotone - Sea temperature| Month |
|---|
| January | 15 |
|---|
| February | 14.5 |
|---|
| March | 14.5 |
|---|
| April | 15.5 |
|---|
| May | 18.5 |
|---|
| June | 22.5 |
|---|
| July | 25 |
|---|
| August | 26 |
|---|
| September | 24.5 |
|---|
| October | 22 |
|---|
| November | 19"> |
|---|
| December | 16 |
|---|
| Year | 19.5 |
|---|
There are on average around 2450
sunshine hours per year. Here are the average hours of sunshine per day.
Crotone - Sunshine hours| Month | Average | Total |
|---|
| January | 4 | 130 |
|---|
| February | 5 | 140 |
|---|
| March | 5.5 | 170 |
|---|
| April | 6.5 | 195 |
|---|
| May | 8 | 250 |
|---|
| June | 9.5 | 280 |
|---|
| July | 10 | 315 |
|---|
| August | 9.5 | 290 |
|---|
| September | 7.5 | 230 |
|---|
| October | 6 | 190 |
|---|
| November | 5 | 145 |
|---|
| December | 4 | 120 |
|---|
| Year | 6.7 | 2450 |
|---|