Select units of measurement for the temperature and rainfall tables (metric or imperial).
Average weather, temperature, rainfall, sunshine hours
The climate of Chieti can be described as
transitional Mediterranean, since it has relatively mild winters and hot, sunny summers.
Sometimes, especially in winter, the cold wind can blow from the plains of Eastern Europe. On other occasions, the garbino, the warm wind that comes down from the mountains, can blow.
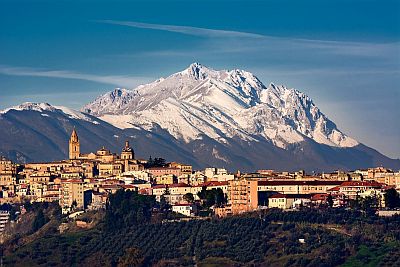
The city is located in Abruzzo, at an altitude of 330 meters (1,080 feet), and 13 km (8 mi) away from the coast of the Adriatic Sea, where Pescara is located. To the west we find the lower part of the city,
Chieti scalo, set in the valley of the Pescara river and hot in summer.
About 35 km (21 mi) to the west are the easternmost buttresses of the
Gran Sasso massif, while 25 km (15 mi) to the south is the
Maiella, both protected in a national park.
Winter, from December to February, is quite mild, however, due to the altitude and distance from the sea, it is a little colder than on the coast.
Snow in Chieti is not very frequent, however, during cold air irruptions from the north-east, with the humid air from the sea rising as it meets the Apennines, sometimes snowfalls can be abundant. In past decades, an average of 30-35 cm (12-13.5 in) of snow fell per year.
During
cold spells, which are becoming rarer due to global warming, the temperature can drop by several degrees below freezing.

The
summer, from June to August, is hot and sunny, with rare rainy days and a few thunderstorms coming from the Apennines.
The humidity is not as high as on the coast, however, due to the distance from the sea it can get very hot, especially when the wind blows from the southwest. Sometimes, the temperature can reach 38-40 °C (100-104 °F).
Best Time
The
best times to visit Chieti are spring and autumn, ie from mid-April to mid-June and from September to early October. In June, the weather is often nice, but it can sometimes get hot, especially in the second half of the month.
Chieti - Climate data
In Chieti, the
average temperature of the coldest month (January) is of
6.9 °C, that of the warmest month (August) is of
24.9 °C. Here are the average temperatures.
Chieti - Average temperatures (1991-2014) |
| Month | Min | Max | Mean |
|---|
| January | 4.2 | 9.7 | 6.9 |
|---|
| February | 4 | 10.2 | 7.1 |
|---|
| March | 6.7 | 13.6 | 10.1 |
|---|
| April | 9.5 | 16.8 | 13.1 |
|---|
| May | 14 | 21.6 | 17.8 |
|---|
| June | 17.9 | 26.1 | 22 |
|---|
| July | 20.5 | 28.8 | 24.6 |
|---|
| August | 20.8 | 29.1 | 24.9 |
|---|
| September | 16.6 | 24.2 | 20.4 |
|---|
| October | 12.9 | 19.6 | 16.2 |
|---|
| November | 8.7 | 14.6 | 11.7 |
|---|
| December | 5.2 | 10.6 | 7.9 |
|---|
| Year | 11.8 | 18.8 | 15.25 |
|---|
amounts to
775 millimeters per year: so, it is at an intermediate level. It ranges from
35 millimeters in the driest month (July) to
85 millimeters in the wettest ones (October, November) Here is the average precipitation.
Chieti - Average precipitation| Month | Days |
|---|
| January | 65 | 8 |
|---|
| February | 60 | 8 |
|---|
| March | 65 | 8 |
|---|
| April | 65 | 7 |
|---|
| May | 45 | 7 |
|---|
| June | 55 | 6 |
|---|
| July | 35 | 4 |
|---|
| August | 55 | 5 |
|---|
| September | 75 | 7 |
|---|
| October | 85 | 8 |
|---|
| November | 85 | 8 |
|---|
| December | 80 | 9 |
|---|
| Year | 775 | 87 |
|---|