Select units of measurement for the temperature and rainfall tables (metric or imperial).
Average weather, temperature, rainfall, sunshine hours

The climate of Caserta is
Mediterranean, with mild, rainy winters and hot, sunny summers.
The city is located in southern Italy, in the Campania region, in the northern part of the Campanian Plain, and about 25 km (15 mi) north of Naples. In the immediate vicinity of the city, to the north, we find the Colli Tifatini, which reach a height of 600 meters (2,000 ft). The medieval village of Casertavecchia is located at an altitude of 400 metres (1,300 ft).
In the metropolitan area, we find cities such as Santa Maria Capua Vetere, Marcianise and Maddaloni.
Winter, from December to February, is mild, with sunny periods but also periods of bad weather. Sometimes the rains can be abundant, and this can also happen in autumn, in October and in November.
Snow in Caserta is very rare, given the location near the sea and protected by the mountains to the north. In fact, Caserta is one of the least snowy cities in Italy. Occasionally, a light and short snowfall can be observed, but to see an accumulation of a few centimeters (1 cm = 0.4 in) you have to wait several years. This happened in February 1956, January 1985, February 1986, December 2010, December 2014 and February 2018.
During cold waves, the temperature typically drops a few degrees below freezing. At Grazzanise airport, located in the open countryside, the temperature dropped to -6.4 °C (20.5 °F) in February 1993.

The
summer, from June to August, is hot and sunny, with rare thunderstorms that can arrive from the Apennines.
During heat waves of African origin, the temperature can reach 38-40 °C (100-104 °F).
Best Time
The
best times to visit Caserta are spring and autumn, ie from mid-April to mid-June and from September to early October. In June, the weather is often nice, but it can sometimes get hot, especially in the second half of the month.
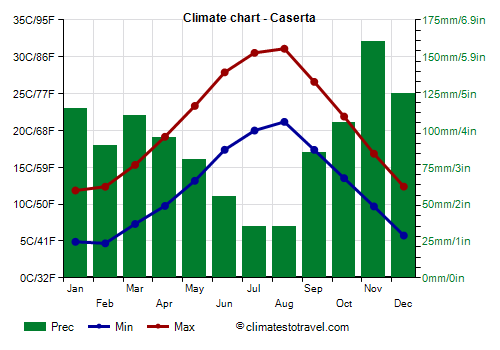
Caserta - Climate data
In Caserta, the
average temperature of the coldest month (January) is of
8.4 °C, that of the warmest month (August) is of
26.1 °C. Here are the average temperatures.
Caserta - Average temperatures (1991-2014) |
| Month | Min | Max | Mean |
|---|
| January | 4.9 | 11.9 | 8.4 |
|---|
| February | 4.7 | 12.4 | 8.5 |
|---|
| March | 7.3 | 15.3 | 11.3 |
|---|
| April | 9.8 | 19.2 | 14.5 |
|---|
| May | 13.2 | 23.3 | 18.3 |
|---|
| June | 17.4 | 27.9 | 22.6 |
|---|
| July | 20 | 30.5 | 25.3 |
|---|
| August | 21.2 | 31.1 | 26.1 |
|---|
| September | 17.4 | 26.6 | 22 |
|---|
| October | 13.5 | 21.9 | 17.7 |
|---|
| November | 9.7 | 16.8 | 13.3 |
|---|
| December | 5.8 | 12.4 | 9.1 |
|---|
| Year | 12.1 | 20.8 | 16.45 |
|---|
amounts to
1090 millimeters per year: it is therefore quite abundant. It ranges from
35 millimeters in the driest months (July, August) to
160 millimeters in the wettest one (November). Here is the average precipitation.
Caserta - Average precipitation| Month | Days |
|---|
| January | 115 | 9 |
|---|
| February | 90 | 9 |
|---|
| March | 110 | 8 |
|---|
| April | 95 | 9 |
|---|
| May | 80 | 5 |
|---|
| June | 55 | 3 |
|---|
| July | 35 | 2 |
|---|
| August | 35 | 4 |
|---|
| September | 85 | 6 |
|---|
| October | 105 | 8 |
|---|
| November | 160 | 10 |
|---|
| December | 125 | 10 |
|---|
| Year | 1090 | 83 |
|---|