Select units of measurement for the temperature and rainfall tables (metric or imperial).
Average weather, temperature, rainfall, sunshine hours

The climate of Makassar (formerly Ujung Pandang) is
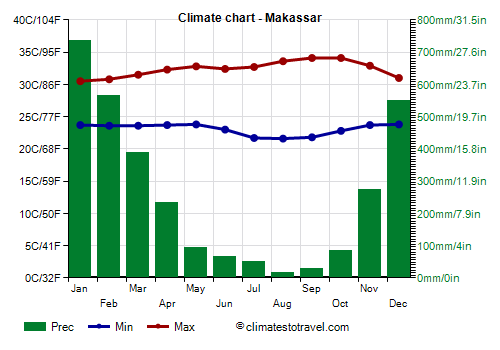
tropical, with a rainy season from November to April (due to the northwest monsoon) and a dry season from June to September (due to the southeast monsoon), with May and October as transitional months.
The city is the capital of the province of South Sulawesi and is located on the southern peninsula of the island of Sulawesi (or Celebes), at 5 degrees south latitude. Sulawesi is the southernmost of the four Great Sunda Islands (the other three being Java, Sumatra and Borneo).
The interior of the peninsula is crossed by
mountains, which influence the rainfall regime. To the east of Makassar there is a mountainous area, protected in the Bantimurung - Bulusaraung National Park, where the altitude reaches about 1,500 meters (4,900 feet), while to the south-east is mount Moncong Lompobatang, of 2,874 meters (9,429 feet). Nearby is a slightly lower mountain, Bawakaraeng, where the Jeneberang River has its source, which flows into the sea near Makassar, and sometimes floods the city in the wettest period, from December to March.
Indeed, the rains brought by the north-west monsoon are particularly abundant because Makassar is exposed on the western side, while in the period of the south-east monsoon the rains are rare, especially in August and September.
In this season, during the day it is very hot. The highest temperatures are recorded at the end of this period, from August to October, or in November when it does not rain. In 2015, the temperature reached 38.6 °C (101.5 °F) in September and 39 °C (102 °F) in October.
Since we are close to the Equator, the
length of day and night is very similar throughout the year. The day lasts 11 hours 50 minutes on June 21, and 12 hours 25 minutes on December 21. The sun reaches the zenith at noon around October 6 and March 7.
Being close to the equator, Makassar (and in general the island of Celebes) is not affected by
tropical cyclones.
Makassar - Climate data
In Makassar, the
average temperature of the coldest month (January) is of
27.1 °C, that of the warmest month (October) is of
28.4 °C. Here are the average temperatures.
Makassar - Average temperatures (1991-2020) |
| Month | Min | Max | Mean |
|---|
| January | 23.7 | 30.5 | 27.1 |
|---|
| February | 23.6 | 30.8 | 27.2 |
|---|
| March | 23.6 | 31.5 | 27.6 |
|---|
| April | 23.7 | 32.3 | 28 |
|---|
| May | 23.8 | 32.8 | 28.3 |
|---|
| June | 23 | 32.4 | 27.7 |
|---|
| July | 21.7 | 32.7 | 27.2 |
|---|
| August | 21.6 | 33.6 | 27.6 |
|---|
| September | 21.8 | 34.1 | 28 |
|---|
| October | 22.8 | 34.1 | 28.4 |
|---|
| November | 23.7 | 32.9 | 28.3 |
|---|
| December | 23.8 | 31 | 27.4 |
|---|
| Year | 23.1 | 32.4 | 27.65 |
|---|
amounts to
3085 millimeters per year: it is therefore very abundant. It ranges from
15 millimeters in the driest month (August) to
735 millimeters in the wettest one (January). Here is the average precipitation.
Makassar - Average precipitation| Month | Days |
|---|
| January | 735 | 27 |
|---|
| February | 565 | 26 |
|---|
| March | 390 | 23 |
|---|
| April | 235 | 18 |
|---|
| May | 95 | 8 |
|---|
| June | 65 | 6 |
|---|
| July | 50 | 4 |
|---|
| August | 15 | 1 |
|---|
| September | 30 | 2 |
|---|
| October | 85 | 7 |
|---|
| November | 275 | 17 |
|---|
| December | 550 | 24 |
|---|
| Year | 3085 | 163 |
|---|
The
sea temperature ranges from
28 °C in July, August, September to
29.5 °C in March, April, May, November, December. Here are the average sea temperatures.
Makassar - Sea temperature| Month |
|---|
| January | 29 |
|---|
| February | 29 |
|---|
| March | 29.5 |
|---|
| April | 29.5 |
|---|
| May | 29.5 |
|---|
| June | 29 |
|---|
| July | 28 |
|---|
| August | 28 |
|---|
| September | 28 |
|---|
| October | 29 |
|---|
| November | 29.5"> |
|---|
| December | 29.5 |
|---|
| Year | 29 |
|---|
There are on average around 2910
sunshine hours per year. Here are the average hours of sunshine per day.
Makassar - Sunshine hours| Month | Average | Total |
|---|
| January | 5.5 | 175 |
|---|
| February | 6.5 | 180 |
|---|
| March | 7 | 215 |
|---|
| April | 7.5 | 230 |
|---|
| May | 8.5 | 260 |
|---|
| June | 8.5 | 255 |
|---|
| July | 9 | 275 |
|---|
| August | 9.5 | 300 |
|---|
| September | 10 | 305 |
|---|
| October | 9.5 | 290 |
|---|
| November | 8 | 235 |
|---|
| December | 6.5 | 200 |
|---|
| Year | 8 | 2910 |
|---|