Select units of measurement for the temperature and rainfall tables (metric or imperial).
Average weather, temperature, rainfall, sunshine hours

The climate of Bandung is
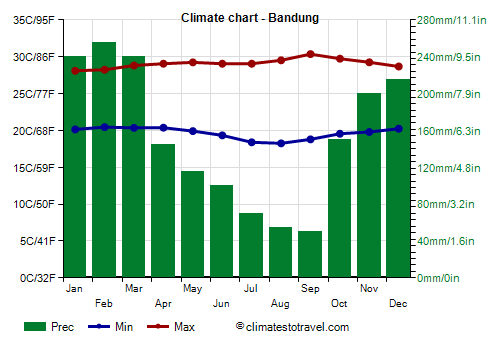
tropical, with a rainy season from October to May and a relatively dry season from June to September.
The city is the capital of the province of Western Java and is located in the interior the most populated island of Indonesia, in a valley at an altitude ranging from 650 to 1,050 meters (2,130 to 4,150 feet) above sea level, the center being at 700 meters (2,300 feet). Just to the west is the sister city of Cimahi.
The altitude slightly tempers the heat, which is less intense than in the other main cities of Indonesia.
November to March is the period of the
northwest monsoon, during which the rains are more frequent and abundant and the sky is more often cloudy.
As a result of particularly heavy rains, Bandung is prone to flooding. Generally, the period in which they can occur runs from late October to late March.
June to September is the period of the
south-east monsoon, which brings rain on the southern side of Java (at least in the western part of the island), while in inland areas and on the north side, the weather is generally good, and showers and thunderstorms occur quite rarely.
In the dry season, the humidity decreases slightly, while the temperature range increases, so it is a little cooler at night and a little warmer during the day. On the other hand, in August, temperatures begin to rise again slightly, and the period with the highest temperatures of the year begins, before the rainy season. As a result, at night the temperature can drop as low as 15/16 °C (59/61 °F) from June to August, while during the day it can reach 33/34 °C (91/93 °F) from September to November.
Since we are close to the Equator, the
length of day and night is very similar throughout the year. The day lasts 11 hours 45 minutes on June 21, and 12 hours 30 minutes on December 21. The sun reaches the zenith at noon around October 10 and March 3.
Being close to the Equator and in the interior of Java, Bandung is not affected by
tropical cyclones. In the warm period of the southern hemisphere (between November and May, but more likely between December and mid-April), tropical cyclones can sometimes form on the Indian Ocean, which pass off the southern coast of Java, in the area of the Cocos Islands and of Christmas Island, and can bring heavy rain on the southern coast of Java.
Bandung - Climate data
In Bandung, the
average temperature of the coldest month (July) is of
23.7 °C, that of the warmest month (April) is of
24.7 °C. Here are the average temperatures.
Bandung - Average temperatures (2000-2020) |
| Month | Min | Max | Mean |
|---|
| January | 20.2 | 28.1 | 24.1 |
|---|
| February | 20.5 | 28.2 | 24.4 |
|---|
| March | 20.4 | 28.8 | 24.6 |
|---|
| April | 20.4 | 29.1 | 24.7 |
|---|
| May | 19.9 | 29.2 | 24.6 |
|---|
| June | 19.3 | 29.1 | 24.2 |
|---|
| July | 18.4 | 29.1 | 23.7 |
|---|
| August | 18.3 | 29.5 | 23.9 |
|---|
| September | 18.8 | 30.4 | 24.6 |
|---|
| October | 19.6 | 29.7 | 24.6 |
|---|
| November | 19.8 | 29.2 | 24.5 |
|---|
| December | 20.2 | 28.7 | 24.5 |
|---|
| Year | 19.6 | 29.1 | 24.3 |
|---|
amounts to
1840 millimeters per year: it is therefore abundant. It ranges from
50 millimeters in the driest month (September) to
255 millimeters in the wettest one (February). Here is the average precipitation.
Bandung - Average precipitation| Month | Days |
|---|
| January | 240 | 22 |
|---|
| February | 255 | 20 |
|---|
| March | 240 | 21 |
|---|
| April | 145 | 18 |
|---|
| May | 115 | 13 |
|---|
| June | 100 | 8 |
|---|
| July | 70 | 6 |
|---|
| August | 55 | 5 |
|---|
| September | 50 | 7 |
|---|
| October | 150 | 13 |
|---|
| November | 200 | 19 |
|---|
| December | 215 | 22 |
|---|
| Year | 1840 | 156 |
|---|
There are on average around 2465
sunshine hours per year. Here are the average hours of sunshine per day.
Bandung - Sunshine hours| Month | Average | Total |
|---|
| January | 5 | 155 |
|---|
| February | 6 | 170 |
|---|
| March | 6 | 185 |
|---|
| April | 7 | 210 |
|---|
| May | 7 | 215 |
|---|
| June | 8 | 240 |
|---|
| July | 8 | 250 |
|---|
| August | 8 | 250 |
|---|
| September | 7 | 210 |
|---|
| October | 7 | 215 |
|---|
| November | 6 | 180 |
|---|
| December | 6 | 185 |
|---|
| Year | 6.8 | 2465 |
|---|