Select units of measurement for the temperature and rainfall tables (metric or imperial).
Average weather, temperature, rainfall, sunshine hours

The climate of Puerto Deseado is
temperate arid, with quite cold winters (from June to August) and mild summers (from December to February).
Due to the westerlies, which prevail all year round and descend from the Andes, the climate is particularly arid, but also milder than the latitude might suggest. However, there may be temperature changes due to cold winds from the south, of Antarctic origin, or warm winds from the northwest.
In addition, the
wind, which blows all year round, often moderate or strong, increases the feeling of cold.
Since the
winter is quite dry, snowfall is rare and not abundant. Also, since the city is located on the coast, cold air does not settle easily on the ground, and during the day the temperature usually exceeds freezing, except during the most intense cold waves. The record is -10.5 °C (13 °F), set in July 1961.
Although the
summer is not hot, there can sometimes be short heat waves. However, since the sea is cold even in summer, the temperature usually drops a lot in the evening due to the breeze. From December to March the temperature can exceed 35 °C (95 °F). The record is 40.1 °C (104.2 °F), set in February 2011.
When the wind blows from the south, it can get cold even in summer, so much so that the cold records are close to freezing even in this season.
Puerto Deseado is a town of 14,000 inhabitants located in Argentina, at 47 degrees south latitude, in the province of Santa Cruz, and on the coast of the South Atlantic Ocean. To the west is the Patagonian plateau.
Puerto Deseado - Climate data
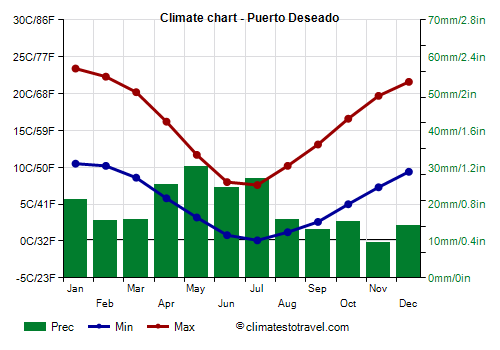
In Puerto Deseado, the
average temperature of the coldest month (July) is of
3.8 °C, that of the warmest month (January) is of
17 °C. Here are the average temperatures.
Puerto Deseado - Average temperatures (1991-2020) |
| Month | Min | Max | Mean |
|---|
| January | 10.5 | 23.4 | 17 |
|---|
| February | 10.2 | 22.3 | 16.2 |
|---|
| March | 8.6 | 20.2 | 14.4 |
|---|
| April | 5.8 | 16.2 | 11 |
|---|
| May | 3.2 | 11.7 | 7.4 |
|---|
| June | 0.8 | 8 | 4.4 |
|---|
| July | 0.1 | 7.6 | 3.8 |
|---|
| August | 1.2 | 10.2 | 5.7 |
|---|
| September | 2.6 | 13.1 | 7.8 |
|---|
| October | 5 | 16.6 | 10.8 |
|---|
| November | 7.3 | 19.7 | 13.5 |
|---|
| December | 9.4 | 21.6 | 15.5 |
|---|
| Year | 5.4 | 15.8 | 10.6 |
|---|
amounts to
230 millimeters per year: it is therefore scarce. It ranges from
9.5 millimeters in the driest month (November) to
30.2 millimeters in the wettest one (May). Here is the average precipitation.
Puerto Deseado - Average precipitation| Month | Days |
|---|
| January | 21 | 8 |
|---|
| February | 16 | 6 |
|---|
| March | 16 | 6 |
|---|
| April | 25 | 7 |
|---|
| May | 30 | 10 |
|---|
| June | 25 | 9 |
|---|
| July | 27 | 8 |
|---|
| August | 16 | 7 |
|---|
| September | 13 | 6 |
|---|
| October | 15 | 6 |
|---|
| November | 10 | 6 |
|---|
| December | 14 | 6 |
|---|
| Year | 230 | 85 |
|---|
The
sea temperature ranges from
7.5 °C in August, September to
14.5 °C in February. Here are the average sea temperatures.
Puerto Deseado - Sea temperature| Month |
|---|
| January | 14 |
|---|
| February | 14.5 |
|---|
| March | 14 |
|---|
| April | 12 |
|---|
| May | 10.5 |
|---|
| June | 9 |
|---|
| July | 8 |
|---|
| August | 7.5 |
|---|
| September | 7.5 |
|---|
| October | 8.5 |
|---|
| November | 10"> |
|---|
| December | 12 |
|---|
| Year | 10.5 |
|---|
There are on average around 1865
sunshine hours per year. Here are the average hours of sunshine per day.
Puerto Deseado - Sunshine hours| Month | Average | Total |
|---|
| January | 7.5 | 235 |
|---|
| February | 7.5 | 215 |
|---|
| March | 5.5 | 165 |
|---|
| April | 4.5 | 135 |
|---|
| May | 3.5 | 100 |
|---|
| June | 2.5 | 75 |
|---|
| July | 3 | 95 |
|---|
| August | 4 | 120 |
|---|
| September | 4 | 120 |
|---|
| October | 6 | 180 |
|---|
| November | 7 | 210 |
|---|
| December | 6.5 | 205 |
|---|
| Year | 5.1 | 1865 |
|---|