Select units of measurement for the temperature and rainfall tables (metric or imperial).
Average weather, temperature, rainfall, sunshine hours

The climate of Pigüé is
temperate oceanic.
However, throughout the year, there can be
temperature fluctuations.
Winter, from June to August, is quite mild, however, it can get cold at night. Sometimes fog can form. During cold spells, the temperature can drop several degrees below freezing, at least at night. The records in the winter months are equal to or lower than -8 °C (17.5 °F). In July 1995 the temperature reached -12.2 °C (10 °F). However, snow is rare.
Summer, from December to February, is warm, but with cool nights, and quite frequent thunderstorms. There can be heat waves, during which the temperature can reach 38/40 °C (100/104 °F). On other occasions, it can get very cool, or even a little cold, at night.
Pigüé is a town located in Argentina, at 37 degrees south latitude and 300 meters (985 feet) above sea level, in the Buenos Aires Province.
Pigue - Climate data
In Pigue, the
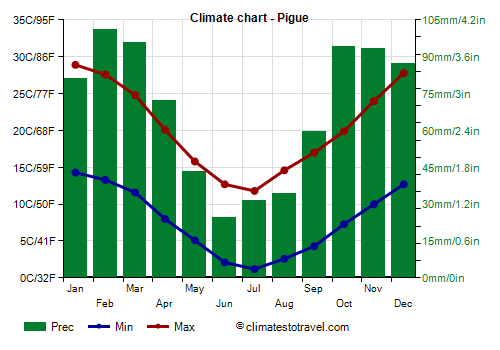
average temperature of the coldest month (July) is of
6.5 °C, that of the warmest month (January) is of
21.6 °C. Here are the average temperatures.
Pigue - Average temperatures (1991-2020) |
| Month | Min | Max | Mean |
|---|
| January | 14.3 | 28.9 | 21.6 |
|---|
| February | 13.3 | 27.6 | 20.5 |
|---|
| March | 11.6 | 24.8 | 18.2 |
|---|
| April | 8 | 20.1 | 14 |
|---|
| May | 5.1 | 15.8 | 10.4 |
|---|
| June | 2.1 | 12.7 | 7.4 |
|---|
| July | 1.2 | 11.8 | 6.5 |
|---|
| August | 2.6 | 14.6 | 8.6 |
|---|
| September | 4.3 | 17 | 10.6 |
|---|
| October | 7.3 | 19.9 | 13.6 |
|---|
| November | 10 | 24 | 17 |
|---|
| December | 12.7 | 27.8 | 20.2 |
|---|
| Year | 7.7 | 20.4 | 14 |
|---|
amounts to
820 millimeters per year: so, it is at an intermediate level. It ranges from
24.5 millimeters in the driest month (June) to
101.2 millimeters in the wettest one (February). Here is the average precipitation.
Pigue - Average precipitation| Month | Days |
|---|
| January | 81 | 7 |
|---|
| February | 101 | 6 |
|---|
| March | 96 | 6 |
|---|
| April | 72 | 5 |
|---|
| May | 43 | 4 |
|---|
| June | 24 | 3 |
|---|
| July | 32 | 4 |
|---|
| August | 34 | 4 |
|---|
| September | 60 | 5 |
|---|
| October | 94 | 7 |
|---|
| November | 93 | 7 |
|---|
| December | 87 | 7 |
|---|
| Year | 820 | 66 |
|---|
There are on average around 2605
sunshine hours per year. Here are the average hours of sunshine per day.
Pigue - Sunshine hours| Month | Average | Total |
|---|
| January | 9.5 | 300 |
|---|
| February | 9.5 | 270 |
|---|
| March | 7.5 | 240 |
|---|
| April | 6.5 | 200 |
|---|
| May | 5.5 | 170 |
|---|
| June | 4.5 | 130 |
|---|
| July | 4.5 | 135 |
|---|
| August | 6 | 190 |
|---|
| September | 6.5 | 195 |
|---|
| October | 7.5 | 230 |
|---|
| November | 9 | 265 |
|---|
| December | 9 | 275 |
|---|
| Year | 7.1 | 2605 |
|---|