Select units of measurement for the temperature and rainfall tables (metric or imperial).
Average weather, temperature, rainfall, sunshine hours

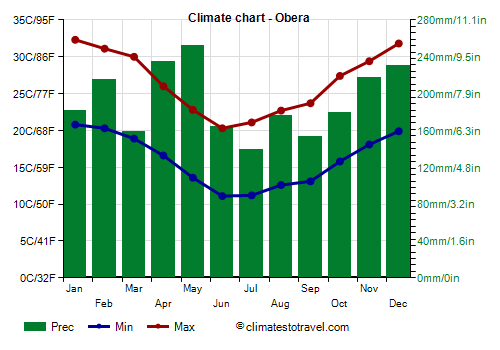
The climate of Oberá is
subtropical, with very mild winters and hot summers.
The
rains are abundant and there is no dry season, however, they are more abundant in autumn and winter, and a little less in the southern winter. In fact, from June to August there are periods without rain of a week or two, although it depends on the years.
The
winter, from mid-May to mid-August, is very mild, however, there can sometimes be periods a bit cold, especially at night, when the temperature can drop to around freezing or a little below.
During the day it can get
hot all year round, in fact, the heat records exceed 30 °C (86 °F) even in winter. Instead, from September to March, there can be heat waves, in which the temperature reaches 38/40 °C (100/104 °F).
Oberá is a city of 64,000 inhabitants located in the north-east of Argentina, at 27 degrees south latitude and 300 meters (985 feet) above sea level, in the province of Misiones, the most northeastern and the rainiest of the Argentine provinces.
Obera - Climate data
In Obera, the
average temperature of the coldest month (June) is of
15.7 °C, that of the warmest month (January) is of
26.6 °C. Here are the average temperatures.
Obera - Average temperatures (1981-1990) |
| Month | Min | Max | Mean |
|---|
| January | 20.8 | 32.3 | 26.6 |
|---|
| February | 20.3 | 31.1 | 25.7 |
|---|
| March | 18.9 | 30 | 24.4 |
|---|
| April | 16.6 | 26 | 21.3 |
|---|
| May | 13.6 | 22.8 | 18.2 |
|---|
| June | 11.1 | 20.3 | 15.7 |
|---|
| July | 11.2 | 21.1 | 16.2 |
|---|
| August | 12.6 | 22.7 | 17.6 |
|---|
| September | 13.1 | 23.7 | 18.4 |
|---|
| October | 15.8 | 27.4 | 21.6 |
|---|
| November | 18.1 | 29.4 | 23.8 |
|---|
| December | 19.9 | 31.8 | 25.8 |
|---|
| Year | 16 | 26.5 | 21.2 |
|---|
amounts to
2300 millimeters per year: it is therefore abundant. It ranges from
138.8 millimeters in the driest month (July) to
252 millimeters in the wettest one (May). Here is the average precipitation.
Obera - Average precipitation| Month | Days |
|---|
| January | 182 | 12 |
|---|
| February | 216 | 11 |
|---|
| March | 159 | 9 |
|---|
| April | 235 | 11 |
|---|
| May | 252 | 9 |
|---|
| June | 164 | 11 |
|---|
| July | 139 | 10 |
|---|
| August | 176 | 10 |
|---|
| September | 154 | 11 |
|---|
| October | 179 | 10 |
|---|
| November | 217 | 11 |
|---|
| December | 231 | 9 |
|---|
| Year | 2300 | 124 |
|---|