Select units of measurement for the temperature and rainfall tables (metric or imperial).
Average weather, temperature, rainfall, sunshine hours

Gobernador Gregores has a
temperate arid climate, with cold winters and cool summers.
The
wind, which blows all year round, often moderate or strong, increases the feeling of cold. In addition, there are temperature changes from one day to the next.
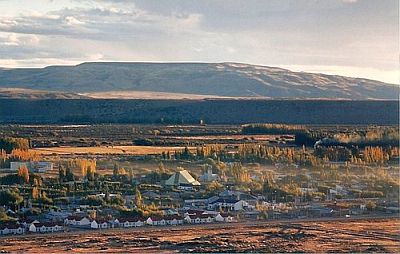
The town, formerly known as Cañadón León, is located in southern Argentina, in the province of Santa Cruz, in Patagonia, at 280 meters (920 feet) above sea level and almost 49 degrees south latitude.
To the west are glacial lakes, Lakes Cardiel and Strobel. To the northwest, occupied by mountains and valleys that descend to 900 meters (2,950 ft) above sea level, is the
Perito Moreno National Park.

In
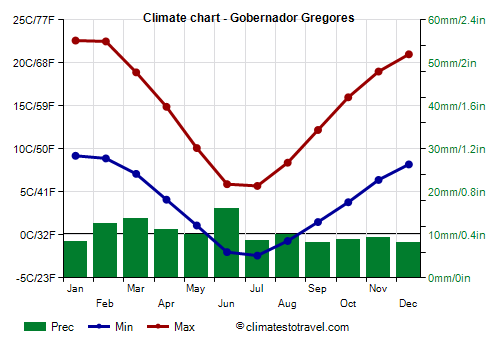
winter, from June to August, the average temperature is slightly above freezing. Snowfall, which is usually not abundant since the climate is dry, generally occurs from May to September.
In addition, there can be cold spells, where the temperature can drop to around -15 °C (5 °F), and occasionally below. The record is -22.4 °C (-8.3 °F), set in August 1977. In June 2019, the temperature dropped to -19 °C (-2 °F), a value that had not been reached for several years.
Summer, from December to February, is mild during the day, with often cold nights. The records are around 0 °C (32 °F) even in summer.
However, there can sometimes be short-lived heatwaves. From December to March, the temperature can reach or exceed 35 °C (95 °F). The record is 38.5 °C (101.3 °F), set in January 2013.
Best Time
The mildest time in Gobernador Gregores is the summer, from December to February. However, since it can sometimes get very hot (albeit rarely and for short periods), you can choose November, a spring month. It is worth remembering that at night, it can get cold also in these months.
Gobernador Gregores - Climate data
In Gobernador Gregores, the
average temperature of the coldest month (July) is of
1.6 °C, that of the warmest month (January) is of
15.9 °C. Here are the average temperatures.
Gobernador Gregores - Average temperatures (1991-2020) |
| Month | Min | Max | Mean |
|---|
| January | 9.2 | 22.6 | 15.9 |
|---|
| February | 8.9 | 22.5 | 15.7 |
|---|
| March | 7.1 | 18.9 | 13 |
|---|
| April | 4.1 | 14.9 | 9.5 |
|---|
| May | 1.1 | 10.1 | 5.6 |
|---|
| June | -2 | 5.9 | 2 |
|---|
| July | -2.4 | 5.7 | 1.6 |
|---|
| August | -0.7 | 8.4 | 3.8 |
|---|
| September | 1.5 | 12.2 | 6.8 |
|---|
| October | 3.8 | 16 | 9.9 |
|---|
| November | 6.4 | 19 | 12.7 |
|---|
| December | 8.2 | 21 | 14.6 |
|---|
| Year | 3.7 | 14.7 | 9.2 |
|---|
amounts to
125 millimeters per year: it is therefore at a desert level. It ranges from
8.1 millimeters in the driest months (September, December) to
16.2 millimeters in the wettest one (June). Here is the average precipitation.
Gobernador Gregores - Average precipitation| Month | Days |
|---|
| January | 8 | 2 |
|---|
| February | 13 | 3 |
|---|
| March | 14 | 3 |
|---|
| April | 11 | 2 |
|---|
| May | 10 | 2 |
|---|
| June | 16 | 4 |
|---|
| July | 9 | 3 |
|---|
| August | 10 | 2 |
|---|
| September | 8 | 3 |
|---|
| October | 9 | 2 |
|---|
| November | 9 | 2 |
|---|
| December | 8 | 2 |
|---|
| Year | 125 | 30 |
|---|
There are on average around 2250
sunshine hours per year. Here are the average hours of sunshine per day.
Gobernador Gregores - Sunshine hours| Month | Average | Total |
|---|
| January | 8.5 | 260 |
|---|
| February | 8 | 230 |
|---|
| March | 6.5 | 205 |
|---|
| April | 5.5 | 165 |
|---|
| May | 4.5 | 130 |
|---|
| June | 3.5 | 110 |
|---|
| July | 4 | 125 |
|---|
| August | 5 | 150 |
|---|
| September | 5.5 | 170 |
|---|
| October | 7 | 225 |
|---|
| November | 8 | 245 |
|---|
| December | 7.5 | 230 |
|---|
| Year | 6.2 | 2250 |
|---|