Select units of measurement for the temperature and rainfall tables (metric or imperial).
Average weather, temperature, rainfall, sunshine hours

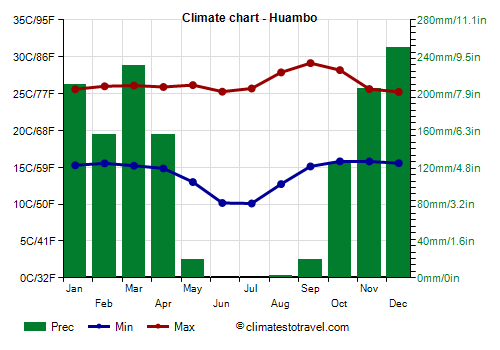
In Huambo, formerly Nova Lisboa, there is a
subtropical climate, influenced by altitude, with a dry, relatively cool winter from May to mid-August, during which it can get cold at night (5 °C or 41 °F - and sometimes even less), and a rainy period from mid-October to April.
Daytime temperatures are quite stable, however, at the end of the dry season, from mid-August to October, it is the hottest period of the year, during which highs reach 28/29 °C (82/84 °F), and with peaks of 32/33 °C (90/91 °F).
The city is located in the central part of Angola, at 1,700 meters (5,600 feet) above sea level, and 240 km (150 mi) away from the coast of the South Atlantic Ocean. About 70 km (43.5 mi) to the north-west is the highest mountain in the country,
Morro de Moco, 2,620 meters (8,596 ft) high.
Huambo - Climate data
In Huambo, the
average temperature of the coldest month (June) is of
17.7 °C, that of the warmest month (September) is of
22.1 °C. Here are the average temperatures.
Huambo - Average temperatures (2014-2020) |
| Month | Min | Max | Mean |
|---|
| January | 15.3 | 25.6 | 20.4 |
|---|
| February | 15.5 | 26 | 20.8 |
|---|
| March | 15.2 | 26.1 | 20.7 |
|---|
| April | 14.9 | 25.9 | 20.4 |
|---|
| May | 13 | 26.2 | 19.6 |
|---|
| June | 10.2 | 25.3 | 17.7 |
|---|
| July | 10.1 | 25.7 | 17.9 |
|---|
| August | 12.7 | 27.9 | 20.3 |
|---|
| September | 15.1 | 29.1 | 22.1 |
|---|
| October | 15.8 | 28.2 | 22 |
|---|
| November | 15.8 | 25.6 | 20.7 |
|---|
| December | 15.6 | 25.2 | 20.4 |
|---|
| Year | 14.1 | 26.4 | 20.2 |
|---|
amounts to
1365 millimeters per year: it is therefore quite abundant. It ranges from
0 millimeters in the driest months (June, July) to
250 millimeters in the wettest one (December). Here is the average precipitation.
Huambo - Average precipitation| Month | Days |
|---|
| January | 210 | 16 |
|---|
| February | 155 | 14 |
|---|
| March | 230 | 17 |
|---|
| April | 155 | 10 |
|---|
| May | 20 | 2 |
|---|
| June | 0 | 0 |
|---|
| July | 0 | 0 |
|---|
| August | 2 | 0 |
|---|
| September | 20 | 3 |
|---|
| October | 125 | 13 |
|---|
| November | 205 | 18 |
|---|
| December | 250 | 17 |
|---|
| Year | 1365 | 110 |
|---|
There are on average around 2275
sunshine hours per year. Here are the average hours of sunshine per day.
Huambo - Sunshine hours| Month | Average | Total |
|---|
| January | 4.5 | 145 |
|---|
| February | 5 | 140 |
|---|
| March | 4.5 | 145 |
|---|
| April | 5.5 | 170 |
|---|
| May | 8 | 240 |
|---|
| June | 9 | 270 |
|---|
| July | 8.5 | 270 |
|---|
| August | 8 | 255 |
|---|
| September | 6.5 | 200 |
|---|
| October | 5.5 | 165 |
|---|
| November | 4.5 | 135 |
|---|
| December | 4.5 | 140 |
|---|
| Year | 6.2 | 2275 |
|---|