Select units of measurement for the temperature and rainfall tables (metric or imperial).
Average weather, temperature, rainfall, sunshine hours

In Andorra La Vella, the capital of the small state of Andorra, there is a
temperate climate, with quite cold winters and relatively warm summers.
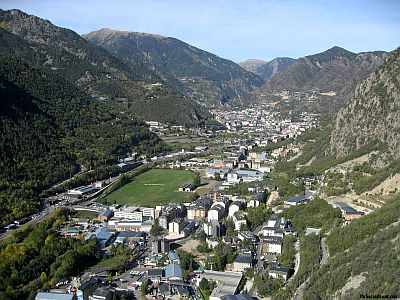
The city is located in the Valira valley, the main one in the country, at around 1,000 meters (3,300 feet) above sea level.
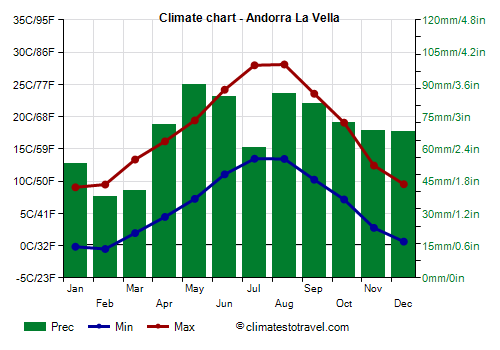
Precipitation amounts to 800 millimeters (32 inches) per year, and it is well distributed throughout the year, although there's a relative minimum in winter and early spring, while the rainiest months are May and June because of afternoon thunderstorms.
During
cold waves, which are becoming rarer due to global warming, the temperature can drop to around -10 °C (14 °F), as happened in early March 2005. In the past, lower values were recorded, such as -15 °C (5 °F) in January 1985, and -16 °C (3 °F), the cold record, set in February 1956.
In summer, during
heat waves, which are becoming more frequent, the temperature can reach 35 °C (95 °F), with peaks of 37/38 °C (99/100 °F).

The following data refers to the
Roc de Sant Pere station, located at 1,100 meters (3,600 ft) above sea level.
Andorra La Vella - Climate data
In Andorra La Vella, the
average temperature of the coldest month (January) is of
4.4 °C, that of the warmest month (August) is of
20.8 °C. Here are the average temperatures.
Andorra La Vella - Average temperatures (2008-2020) |
| Month | Min | Max | Mean |
|---|
| January | -0.2 | 9 | 4.4 |
|---|
| February | -0.5 | 9.5 | 4.5 |
|---|
| March | 2 | 13.4 | 7.6 |
|---|
| April | 4.5 | 16.2 | 10.3 |
|---|
| May | 7.3 | 19.4 | 13.3 |
|---|
| June | 11.1 | 24.2 | 17.6 |
|---|
| July | 13.5 | 28 | 20.7 |
|---|
| August | 13.4 | 28.1 | 20.8 |
|---|
| September | 10.2 | 23.6 | 16.9 |
|---|
| October | 7.2 | 19.1 | 13.1 |
|---|
| November | 2.8 | 12.4 | 7.6 |
|---|
| December | 0.6 | 9.5 | 5.1 |
|---|
| Year | 6 | 17.7 | 11.85 |
|---|
amounts to
810 millimeters per year: so, it is at an intermediate level. It ranges from
37.9 millimeters in the driest month (February) to
89.8 millimeters in the wettest one (May). Here is the average precipitation.
Andorra La Vella - Average precipitation| Month | Days |
|---|
| January | 53 | 6 |
|---|
| February | 38 | 5 |
|---|
| March | 40 | 6 |
|---|
| April | 71 | 9 |
|---|
| May | 90 | 11 |
|---|
| June | 84 | 9 |
|---|
| July | 61 | 7 |
|---|
| August | 86 | 7 |
|---|
| September | 81 | 7 |
|---|
| October | 72 | 8 |
|---|
| November | 68 | 7 |
|---|
| December | 68 | 6 |
|---|
| Year | 810 | 88 |
|---|
There are on average around 2165
sunshine hours per year. Here are the average hours of sunshine per day.
Andorra La Vella - Sunshine hours| Month | Average | Total |
|---|
| January | 5 | 155 |
|---|
| February | 5 | 140 |
|---|
| March | 5 | 155 |
|---|
| April | 6 | 180 |
|---|
| May | 6 | 185 |
|---|
| June | 7 | 210 |
|---|
| July | 9 | 280 |
|---|
| August | 8 | 250 |
|---|
| September | 6 | 180 |
|---|
| October | 5 | 155 |
|---|
| November | 5 | 150 |
|---|
| December | 4 | 125 |
|---|
| Year | 5.9 | 2165 |
|---|