Select units of measurement for the temperature and rainfall tables (metric or imperial).
Average weather, temperature, rainfall, sunshine hours

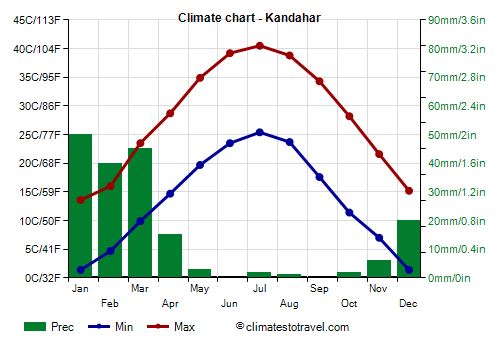
Kandahar is the second largest city in Afghanistan, and is located in the south-east of the country, near the desert, at 1,000 meters (3,300 feet) above sea level.
Winter is mild enough, even though it's cold at night, with possible frosts, and sometimes it can even snow. Summer is scorchingly hot, and as usual in Afghanistan, it's sunny.
Rainfall in Kandahar is very poor, since it doesn't reach 200 mm (8 in) per year. In practice, the only relatively rainy period is from January to March.
In Kandahar, the sun frequently shines throughout the year, but especially in the long hot and dry period from May to October.
Kandahar - Climate data
In Kandahar, the
average temperature of the coldest month (January) is of
7.5 °C, that of the warmest month (July) is of
33 °C. Here are the average temperatures.
Kandahar - Average temperatures (2009-2020) |
| Month | Min | Max | Mean |
|---|
| January | 1.4 | 13.6 | 7.5 |
|---|
| February | 4.7 | 16 | 10.4 |
|---|
| March | 9.9 | 23.5 | 16.7 |
|---|
| April | 14.7 | 28.7 | 21.7 |
|---|
| May | 19.7 | 34.9 | 27.3 |
|---|
| June | 23.5 | 39.2 | 31.4 |
|---|
| July | 25.4 | 40.5 | 33 |
|---|
| August | 23.7 | 38.8 | 31.2 |
|---|
| September | 17.6 | 34.3 | 26 |
|---|
| October | 11.4 | 28.2 | 19.8 |
|---|
| November | 7 | 21.6 | 14.3 |
|---|
| December | 1.4 | 15.2 | 8.3 |
|---|
| Year | 13.4 | 27.9 | 20.65 |
|---|
amounts to
185 millimeters per year: it is therefore at a desert level. It ranges from
0 millimeters in the driest months (June, September) to
50 millimeters in the wettest one (January). Here is the average precipitation.
Kandahar - Average precipitation| Month | Days |
|---|
| January | 50 | 4 |
|---|
| February | 40 | 5 |
|---|
| March | 45 | 6 |
|---|
| April | 15 | 3 |
|---|
| May | 3 | 1 |
|---|
| June | 0 | 0 |
|---|
| July | 2 | 0 |
|---|
| August | 1 | 0 |
|---|
| September | 0 | 0 |
|---|
| October | 2 | 0 |
|---|
| November | 6 | 1 |
|---|
| December | 20 | 3 |
|---|
| Year | 185 | 23 |
|---|
There are on average around 3380
sunshine hours per year. Here are the average hours of sunshine per day.
Kandahar - Sunshine hours| Month | Average | Total |
|---|
| January | 6.5 | 200 |
|---|
| February | 6.5 | 185 |
|---|
| March | 7.5 | 235 |
|---|
| April | 8.5 | 255 |
|---|
| May | 11 | 345 |
|---|
| June | 12.5 | 370 |
|---|
| July | 11 | 340 |
|---|
| August | 11 | 340 |
|---|
| September | 11 | 325 |
|---|
| October | 10 | 305 |
|---|
| November | 9 | 265 |
|---|
| December | 7 | 215 |
|---|
| Year | 9.3 | 3380 |
|---|