Select units of measurement for the temperature and rainfall tables (metric or imperial).
Average weather, temperature, rainfall, sunshine hours

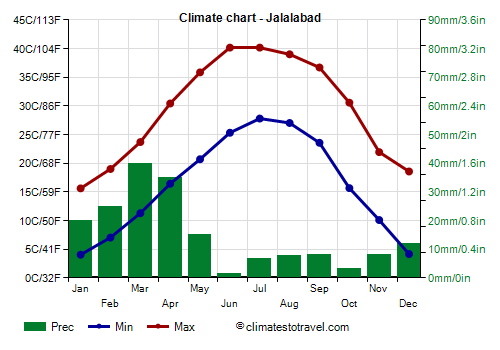
Jalalabad is a city located in the far east of Afghanistan, 600 meters (2,000 feet) above sea level, and has a desert climate, with mild winters and very hot, sunny summers. The little rainfall occurs in winter and spring.
Due to the not too high altitude, and above all to the geographical position, with the Hindu Kush mountains to the north protecting it from cold waves, the city has mild winters, much milder than in Kabul, which is not far away but located in the mountains.
The summer is very hot, and even if it doesn't rain, the humidity is higher than in other cities of Afghanistan, due to the proximity of the Punjab plain, in Pakistan, whose border is located about 60 km (37 mi) to the south-east, beyond the Khyber Pass.
Jalalabad - Climate data
In Jalalabad, the
average temperature of the coldest month (January) is of
9.8 °C, that of the warmest month (July) is of
34 °C. Here are the average temperatures.
Jalalabad - Average temperatures (2017-2020) |
| Month | Min | Max | Mean |
|---|
| January | 4 | 15.6 | 9.8 |
|---|
| February | 7 | 19 | 13 |
|---|
| March | 11.3 | 23.7 | 17.5 |
|---|
| April | 16.4 | 30.4 | 23.4 |
|---|
| May | 20.7 | 35.8 | 28.3 |
|---|
| June | 25.3 | 40.2 | 32.7 |
|---|
| July | 27.8 | 40.2 | 34 |
|---|
| August | 27 | 39 | 33 |
|---|
| September | 23.6 | 36.7 | 30.1 |
|---|
| October | 15.7 | 30.6 | 23.1 |
|---|
| November | 10.1 | 22 | 16 |
|---|
| December | 4.2 | 18.6 | 11.4 |
|---|
| Year | 16.1 | 29.4 | 22.7 |
|---|
amounts to
180 millimeters per year: it is therefore at a desert level. It ranges from
1.4 millimeters in the driest month (June) to
40 millimeters in the wettest one (March). Here is the average precipitation.
Jalalabad - Average precipitation| Month | Days |
|---|
| January | 20 | 4 |
|---|
| February | 25 | 5 |
|---|
| March | 40 | 8 |
|---|
| April | 35 | 8 |
|---|
| May | 15 | 4 |
|---|
| June | 1 | 1 |
|---|
| July | 7 | 1 |
|---|
| August | 8 | 1 |
|---|
| September | 8 | 1 |
|---|
| October | 3 | 1 |
|---|
| November | 8 | 2 |
|---|
| December | 12 | 3 |
|---|
| Year | 180 | 39 |
|---|
There are on average around 3060
sunshine hours per year. Here are the average hours of sunshine per day.
Jalalabad - Sunshine hours| Month | Average | Total |
|---|
| January | 6 | 180 |
|---|
| February | 6.5 | 185 |
|---|
| March | 6.5 | 205 |
|---|
| April | 7.5 | 230 |
|---|
| May | 10 | 305 |
|---|
| June | 11.5 | 340 |
|---|
| July | 10.5 | 325 |
|---|
| August | 9.5 | 300 |
|---|
| September | 10 | 295 |
|---|
| October | 9 | 280 |
|---|
| November | 7.5 | 230 |
|---|
| December | 6 | 185 |
|---|
| Year | 8.4 | 3060 |
|---|