Select units of measurement for the temperature and rainfall tables (metric or imperial).
Average weather, temperature, rainfall, sunshine hours

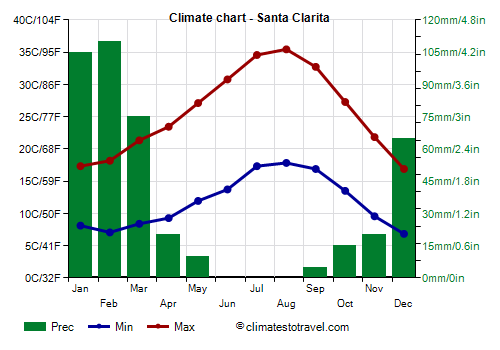
The climate of Santa Clarita is
subtropical semi-arid, with very mild, relatively rainy winters and hot, sunny summers.
The city is located in
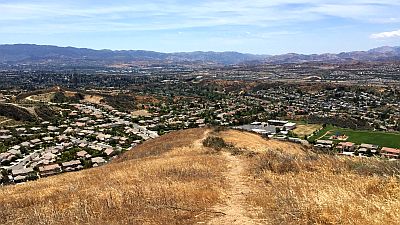
California, in Los Angeles county, in the valley of the same name, at an altitude of 350/400 meters (1,150/1,300 ft). To the south we find San Fernando Valley, from which it is separated by a mountain range, the Santa Susana Mountains.
In
winter, the temperature can sometimes drop to around 0 °C (32 °F) at night. In January 2007, it dropped to -3 °C (26.5 °F).
On the
hottest days of the year, which can also occur in September, the temperature can exceed 40 °C (104 °F). In September 2020, it reached 46 °C (115 °F). This happens when the Santa Ana winds blow from the deserts of Nevada.

Best Time
The
best time to visit Santa Clarita is spring, in March and April, in fact, it is a mild to pleasantly warm and sunny period, and with a very low risk of hot days. Autumn, in October and November, is generally a good season as well, although the Santa Ana winds are quite common, and the first rains can fall, especially in November.
Santa Clarita - Climate data
In Santa Clarita, the
average temperature of the coldest month (December) is of
11.9 °C, that of the warmest month (August) is of
26.6 °C. Here are the average temperatures.
Santa Clarita - Average temperatures (1991-2020) |
| Month | Min | Max | Mean |
|---|
| January | 8.1 | 17.3 | 12.7 |
|---|
| February | 7.1 | 18.2 | 12.6 |
|---|
| March | 8.4 | 21.3 | 14.9 |
|---|
| April | 9.3 | 23.4 | 16.4 |
|---|
| May | 11.9 | 27.1 | 19.5 |
|---|
| June | 13.7 | 30.8 | 22.2 |
|---|
| July | 17.3 | 34.6 | 25.9 |
|---|
| August | 17.8 | 35.4 | 26.6 |
|---|
| September | 16.9 | 32.7 | 24.8 |
|---|
| October | 13.5 | 27.3 | 20.4 |
|---|
| November | 9.6 | 21.8 | 15.7 |
|---|
| December | 6.8 | 16.9 | 11.9 |
|---|
| Year | 11.7 | 25.6 | 18.65 |
|---|
amounts to
425 millimeters per year: it is therefore quite scarce. It ranges from
0 millimeters in the driest months (June, July, August) to
110 millimeters in the wettest one (February). Here is the average precipitation.
Santa Clarita - Average precipitation| Month | Days |
|---|
| January | 105 | 5 |
|---|
| February | 110 | 6 |
|---|
| March | 75 | 4 |
|---|
| April | 20 | 2 |
|---|
| May | 10 | 1 |
|---|
| June | 0 | 0 |
|---|
| July | 0 | 0 |
|---|
| August | 0 | 0 |
|---|
| September | 5 | 1 |
|---|
| October | 15 | 2 |
|---|
| November | 20 | 3 |
|---|
| December | 65 | 5 |
|---|
| Year | 425 | 31 |
|---|