Select units of measurement for the temperature and rainfall tables (metric or imperial).
Average weather, temperature, rainfall, sunshine hours

Ketchikan, the southernmost city in Alaska (it is located at 55 degrees north latitude), has an
oceanic climate, with cold winters and mild summers, and frequent and abundant rainfall throughout the year.
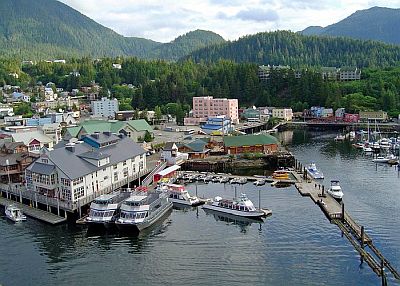
The city is located in southeast Alaska, 95 km (60 mi) from the border with Canada (in the province of British Columbia), on the coast, in an area of islands and fjords.
The average
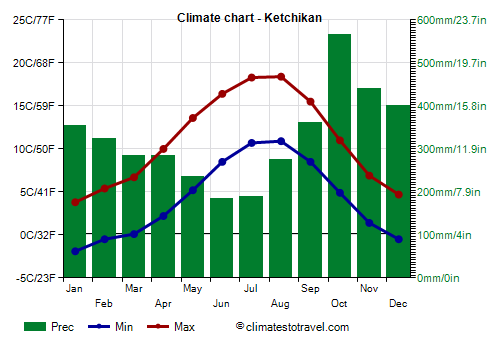
temperature in Ketchikan is 1 °C (33.5 °F) in January and 14.5 °C (58.5 °F) in July and August.
In Ketchikan,
precipitation amounts to almost 4 meters (13 feet) per year. The wettest month is October, with up to 565 mm (22 inches) of rain, while there's a relative minimum in June and July when, however, rainfall is still about 190 mm (7.5 in) per month. Snow usually falls from November to March and totals "only" 1 meter (40 inches) per year, which is certainly not much compared to the huge amount of precipitation that occurs in the cold half of the year.
As one might expect, given the large number of rainy days, the
sun in Ketchikan does not shine very often.

The
winter is cold, cloudy and rainy. The mildest days, in which the temperature can reach around 10 °C (50 °F), are humid and rainy as well, and sometimes windy.
There are also colder periods, when it can snow, and the temperature can drop below freezing.
On the coldest nights of the year, the temperature typically drops to around -10 °C (14 °F), but can sometimes drop lower. In January 2012 it dropped to -19 °C (2 °F).
The
summer is mild, with frequent and abundant rains, though less so than in the rest of the year. In August, the rains become more abundant.
When it doesn't rain, there are pleasant days, with highs above 20 °C (68 °F). Sometimes, there can be warm days, around 25 °C (77 °F).
In recent years, there have also been short, hot periods, in which the temperature has reached 28/29 °C (82/84 °F).
Best Time
The best time to visit Ketchikan is
summer, from June to August, being the mildest season. It must be said that the rains are frequent, especially in August, when they are also more abundant.
Ketchikan - Climate data
In Ketchikan, the
average temperature of the coldest month (January) is of
2 °C, that of the warmest month (August) is of
15 °C. Here are the average temperatures.
Ketchikan - Average temperatures (1991-2020) |
| Month | Min | Max | Mean |
|---|
| January | -0.3 | 4.3 | 2 |
|---|
| February | -0.3 | 5 | 2.4 |
|---|
| March | 0.2 | 6.4 | 3.3 |
|---|
| April | 2.9 | 9.9 | 6.4 |
|---|
| May | 6.3 | 13.9 | 10.1 |
|---|
| June | 9.6 | 16.3 | 13 |
|---|
| July | 11.8 | 18 | 14.9 |
|---|
| August | 11.9 | 18.2 | 15 |
|---|
| September | 9.1 | 15 | 12 |
|---|
| October | 5.2 | 10.6 | 7.9 |
|---|
| November | 2 | 6.5 | 4.2 |
|---|
| December | 0.3 | 4.5 | 2.4 |
|---|
| Year | 4.9 | 10.8 | 7.8 |
|---|
amounts to
3800 millimeters per year: it is therefore very abundant. It ranges from
178.4 millimeters in the driest month (June) to
466.6 millimeters in the wettest one (October). Here is the average precipitation.
Ketchikan - Average precipitation| Month | Days |
|---|
| January | 411 | 20 |
|---|
| February | 300 | 15 |
|---|
| March | 279 | 19 |
|---|
| April | 260 | 17 |
|---|
| May | 220 | 14 |
|---|
| June | 178 | 13 |
|---|
| July | 186 | 13 |
|---|
| August | 287 | 14 |
|---|
| September | 363 | 18 |
|---|
| October | 467 | 21 |
|---|
| November | 434 | 22 |
|---|
| December | 413 | 20 |
|---|
| Year | 3800 | 205 |
|---|
The
sea temperature ranges from
6 °C in February, March to
13 °C in July, August. Here are the average sea temperatures.
Ketchikan - Sea temperature| Month |
|---|
| January | 6.5 |
|---|
| February | 6 |
|---|
| March | 6 |
|---|
| April | 7 |
|---|
| May | 9 |
|---|
| June | 11 |
|---|
| July | 13 |
|---|
| August | 13 |
|---|
| September | 12 |
|---|
| October | 10 |
|---|
| November | 8.5"> |
|---|
| December | 7 |
|---|
| Year | 9.1 |
|---|
There are on average around 1385
sunshine hours per year. Here are the average hours of sunshine per day.
Ketchikan - Sunshine hours| Month | Average | Total |
|---|
| January | 2 | 60 |
|---|
| February | 3 | 80 |
|---|
| March | 3.5 | 110 |
|---|
| April | 5 | 155 |
|---|
| May | 6.5 | 195 |
|---|
| June | 6 | 175 |
|---|
| July | 5.5 | 165 |
|---|
| August | 5 | 160 |
|---|
| September | 4 | 115 |
|---|
| October | 2.5 | 75 |
|---|
| November | 2 | 55 |
|---|
| December | 1.5 | 40 |
|---|
| Year | 3.8 | 1385 |
|---|