Select units of measurement for the temperature and rainfall tables (metric or imperial).
Average weather, temperature, rainfall, sunshine hours

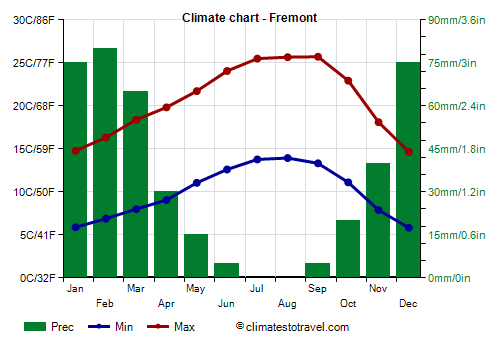
The climate of Fremont can be defined as
Mediterranean, given that the winters are mild and rainy and the summers are hot and sunny, however, the ocean makes the summer milder than in the actual Mediterranean climate.
The city is located in
California, in the southeastern part of San Francisco bay, where summer temperatures are somewhat higher than in San Francisco.
Summer is still pleasant, although for a few days a year, from May to early October, sometimes there can be very hot days, with highs around 35/38 °C (95/100 °F).
In
winter, on colder days, the temperature drops to 0/-2 °C (28/32 °F) at night, and remains around 10/12 °C (50/54 °F) during the day. Snow is extremely rare (in practice it never snows). Real cold waves are also rare, although in December 1990, there has been a very cold period, with highs below 5 °C (41 °F).

The
sea temperature ranges between 12 °C (54 °F) and 15 °C (59 °F). So, it is cold all year round.
Best Time
The best time to visit Fremont is the
summer, from June to September, since it is the driest and warmest season of the year.
Usually, in the months of April, May and October, the weather is good as well, in fact, it is often mild and sunny, even though there's a greater chance of rain; in addition, it can get cold at night, especially in April. Moreover, in spring, afternoon breezes are quite intense.
Fremont - Climate data
In Fremont, the
average temperature of the coldest month (December) is of
10.2 °C, that of the warmest month (August) is of
19.8 °C. Here are the average temperatures.
Fremont - Average temperatures (1991-2020) |
| Month | Min | Max | Mean |
|---|
| January | 5.9 | 14.8 | 10.3 |
|---|
| February | 6.9 | 16.3 | 11.6 |
|---|
| March | 8 | 18.4 | 13.2 |
|---|
| April | 9.1 | 19.8 | 14.4 |
|---|
| May | 11.1 | 21.7 | 16.4 |
|---|
| June | 12.6 | 24.1 | 18.3 |
|---|
| July | 13.8 | 25.5 | 19.6 |
|---|
| August | 13.9 | 25.7 | 19.8 |
|---|
| September | 13.3 | 25.7 | 19.5 |
|---|
| October | 11.1 | 22.9 | 17 |
|---|
| November | 7.9 | 18.1 | 13 |
|---|
| December | 5.8 | 14.7 | 10.2 |
|---|
| Year | 10 | 20.7 | 15.3 |
|---|
amounts to
405 millimeters per year: it is therefore quite scarce. It ranges from
0 millimeters in the driest months (July, August) to
80 millimeters in the wettest one (February). Here is the average precipitation.
Fremont - Average precipitation| Month | Days |
|---|
| January | 75 | 10 |
|---|
| February | 80 | 10 |
|---|
| March | 65 | 10 |
|---|
| April | 30 | 6 |
|---|
| May | 15 | 3 |
|---|
| June | 5 | 1 |
|---|
| July | 0 | 0 |
|---|
| August | 0 | 0 |
|---|
| September | 5 | 1 |
|---|
| October | 20 | 3 |
|---|
| November | 40 | 7 |
|---|
| December | 75 | 10 |
|---|
| Year | 405 | 60 |
|---|
The
sea temperature ranges from
12 °C in March, April, May to
15 °C in September. Here are the average sea temperatures.
Fremont - Sea temperature| Month |
|---|
| January | 12.5 |
|---|
| February | 12.5 |
|---|
| March | 12 |
|---|
| April | 12 |
|---|
| May | 12 |
|---|
| June | 12.5 |
|---|
| July | 13.5 |
|---|
| August | 14.5 |
|---|
| September | 15 |
|---|
| October | 14.5 |
|---|
| November | 14"> |
|---|
| December | 13 |
|---|
| Year | 13.2 |
|---|
There are on average around 3065
sunshine hours per year. Here are the average hours of sunshine per day.
Fremont - Sunshine hours| Month | Average | Total |
|---|
| January | 6 | 185 |
|---|
| February | 7.5 | 210 |
|---|
| March | 8.5 | 270 |
|---|
| April | 10.5 | 310 |
|---|
| May | 10.5 | 325 |
|---|
| June | 10.5 | 310 |
|---|
| July | 10 | 315 |
|---|
| August | 9.5 | 285 |
|---|
| September | 9 | 270 |
|---|
| October | 8 | 245 |
|---|
| November | 6 | 175 |
|---|
| December | 5 | 160 |
|---|
| Year | 8.4 | 3065 |
|---|