Index
Introduction
Alaska, the largest state of the United States with a surface of more than 1.7 million square kilometers (650,000 square miles), largely deserves its reputation of a cold land, but it has also maritime and wet areas, which are not as cold as you might think.
In fact, the average January
temperature is around -25 °C (-13 °F) on the north coast, where there is a
polar climate, and nearly -30 °C (-22 °F) in the inland areas of the north, where there is a
cold continental climate. However, on the southern coasts, where the climate is
subarctic in the inland bays and
oceanic in the areas most exposed to ocean winds, the average in January ranges from -2 to +2 °C (28 to 35 °F).
Precipitation also varies greatly, as it is scarce in the center-north and in the interior, where it generally ranges from 100 to 400 millimeters (4 to 16 inches) per year, while it is abundant in the south, where the climate is affected by the low pressure areas of the Pacific, in fact, it generally exceeds 1,000 mm (40 in) a year on the coasts, and even 5,000 mm (195 in) on mountain slopes exposed to sea currents.
The
sun in Alaska is seen little or not at all in winter, also because the days are very short, and indeed, in the northernmost areas the sun does not even rise. The sunniest period is generally from April to July. The sunniest area is the interior (see Fairbanks), where 2,100 hours of sunshine are recorded per year, while the least sunny is the humid southern area (see the Alaska Peninsula, the Aleutian Islands, Juneau, Ketchikan), where there are 1,300 to 1,500 hours of sunshine per year.
The state is separated from the contiguous United States by Canada, while to the west, across the Bering Strait, lies Siberia.
North coast
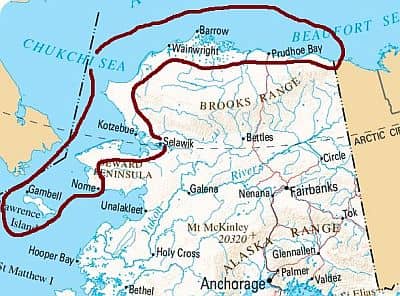
The
north and northwest coasts have a subarctic climate, with long, frigid winters and very cool to cold summers. This is the area of the
tundra. Along the northern and the north-west side, down to the Bering Strait, temperatures are very low, especially in winter, both because of the high latitude and because the sea remains frozen for many months. In addition, this area is influenced by the Siberian air masses, which can easily arrive in this area, moving from west to east.
At Point Hope, on the north-western tip of Alaska, the daily average temperature ranges from -19 °C (-2 °F) in February (which at these latitudes is the coldest month) to 8.5 °C (47 °F) in July and August.
Utqiagvik
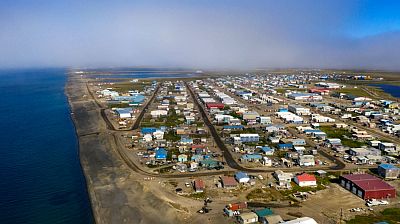
On the north coast, in
Utqiagvik (formerly Barrow), at 71 degrees north latitude, the average temperature ranges from -24.5 °C (-12 °F) in February to 5.5 °C (42 °C) in July. Nearby is Point Barrow (or Nuvuk), the northernmost point of Alaska and the United States.
Here are the average temperatures of Utqiagvik.
Utqiagvik - Average temperatures (1991-2020) | Month | Min (°C) | Max (°C) | Mean (°C) | Min (°F) | Max (°F) | Mean (°F) |
|---|
| January | -27.7 | -20.7 | -24.2 | -18 | -5 | -11.6 |
|---|
| February | -27.9 | -20.9 | -24.4 | -18 | -6 | -11.9 |
|---|
| March | -27.3 | -19.9 | -23.6 | -17 | -4 | -10.5 |
|---|
| April | -19.2 | -11.9 | -15.6 | -3 | 11 | 4 |
|---|
| May | -7.5 | -2.8 | -5.2 | 18 | 27 | 22.7 |
|---|
| June | -0.5 | 5 | 2.2 | 31 | 41 | 36 |
|---|
| July | 2 | 8.7 | 5.4 | 36 | 48 | 41.6 |
|---|
| August | 1.7 | 6.9 | 4.3 | 35 | 44 | 39.7 |
|---|
| September | -1 | 2.8 | 0.9 | 30 | 37 | 33.6 |
|---|
| October | -8.4 | -3.6 | -6 | 17 | 26 | 21.2 |
|---|
| November | -17.8 | -11.4 | -14.6 | 0 | 11 | 5.7 |
|---|
| December | -24.6 | -18 | -21.3 | -12 | 0 | -6.3 |
|---|
| Year | -13.1 | -7.1 | -10.1 | 8.4 | 19.3 | 14 |
|---|
In this coastal area,
precipitation occurs mostly in the form of snow, except in summer, and it is scarce, in fact, it is slightly higher than 300 millimeters (12 inches) per year in the western part and even scarcer, just above 100 mm (4 in), on the north coast. In Utqiagvik it amounts to 140 mm (5.5 in). Here is the average precipitation.
Utqiagvik - Average precipitation| Month | Millimeters | Inches | Days |
|---|
| January | 4 | 0.1 | 1 |
|---|
| February | 5 | 0.2 | 2 |
|---|
| March | 4 | 0.2 | 1 |
|---|
| April | 4 | 0.2 | 1 |
|---|
| May | 7 | 0.3 | 2 |
|---|
| June | 11 | 0.4 | 3 |
|---|
| July | 25 | 1 | 6 |
|---|
| August | 28 | 1.1 | 7 |
|---|
| September | 20 | 0.8 | 6 |
|---|
| October | 14 | 0.5 | 5 |
|---|
| November | 9 | 0.4 | 3 |
|---|
| December | 6 | 0.2 | 2 |
|---|
| Year | 135 | 5.4 | 40 |
|---|
On the north coast, the
sea is frozen solid for many months every year. Remember that the sea freezes at about -2 °C (28 °F).
Utqiagvik - Sea temperature| Month | Celsius (°C) | Fahrenheit (°F) |
|---|
January | -1.5 | 29 | February | -1.5 | 29 | March | -2 | 29 | April | -1.5 | 29 | May | -1.5 | 29 | June | -1 | 30 | July | 0.5 | 33 | August | 2 | 36 | September | 2 | 35 | October | 0.5 | 33 | November | -1 | 30 | December | -1.5 | 29 | Year | -0.6 | 30.9 |
In the extreme north of Alaska, the
sun remains below the horizon for a couple of months, from November 18 to January 22, while it never sets from May 10 to August 2. In late spring and in summer, the sun is seen for a good number of hours, also because of the very long days. However, in this period, in addition to rainy days, sometimes fog can form.
Here are the average sunshine hours per day in Utqiagvik.
Utqiagvik - Sunshine hours| Month | Average | Total |
|---|
January | 0 | 0 | February | 3 | 85 | March | 6 | 185 | April | 9 | 270 | May | 10 | 310 | June | 10 | 300 | July | 10 | 310 | August | 6 | 185 | September | 4 | 120 | October | 2 | 60 | November | 1 | 30 | December | 0 | 0 | Year | 5.1 | 1860 |
Nome
Along the west coast, as you move south, both temperature and precipitation increase. In
Nome, at 64 degrees north latitude, the average temperature is between -14.5 °C (5.5 °F) in January and 11 °C (52 °F) in July.
Nome - Average temperatures (1991-2020) | Month | Min (°C) | Max (°C) | Mean (°C) | Min (°F) | Max (°F) | Mean (°F) |
|---|
| January | -18.9 | -10.4 | -14.6 | -2 | 13 | 5.6 |
|---|
| February | -17 | -8.5 | -12.8 | 1 | 17 | 9 |
|---|
| March | -16.9 | -8 | -12.4 | 2 | 18 | 9.6 |
|---|
| April | -9 | -1.4 | -5.2 | 16 | 29 | 22.6 |
|---|
| May | -0.6 | 6.5 | 3 | 31 | 44 | 37.3 |
|---|
| June | 5.3 | 12.8 | 9 | 42 | 55 | 48.3 |
|---|
| July | 7.9 | 14.3 | 11.1 | 46 | 58 | 52 |
|---|
| August | 6.9 | 13.4 | 10.2 | 44 | 56 | 50.3 |
|---|
| September | 2.9 | 9.5 | 6.2 | 37 | 49 | 43.2 |
|---|
| October | -4 | 2.2 | -0.9 | 25 | 36 | 30.4 |
|---|
| November | -11 | -4.3 | -7.6 | 12 | 24 | 18.2 |
|---|
| December | -16.7 | -8.8 | -12.8 | 2 | 16 | 9 |
|---|
| Year | -5.9 | 1.5 | -2.2 | 21.4 | 34.7 | 28 |
|---|
Precipitation in Nome amounts to 440 mm (17 inches) per year, with a minimum in spring and a maximum in summer.
In the western part of the coast, from December to April the sea is near the freezing point, so in colder periods it can freeze, while the water temperature reaches 10.5 °C (51 °F) in August.
Nome - Sea temperature| Month | Celsius (°C) | Fahrenheit (°F) |
|---|
January | -1 | 30 | February | -1 | 30 | March | -1 | 30 | April | -1 | 30 | May | 0.5 | 33 | June | 4.5 | 40 | July | 9.5 | 49 | August | 10.5 | 51 | September | 9 | 48 | October | 4.5 | 40 | November | 1 | 34 | December | -0.5 | 31 | Year | 2.9 | 37.1 |
West coast
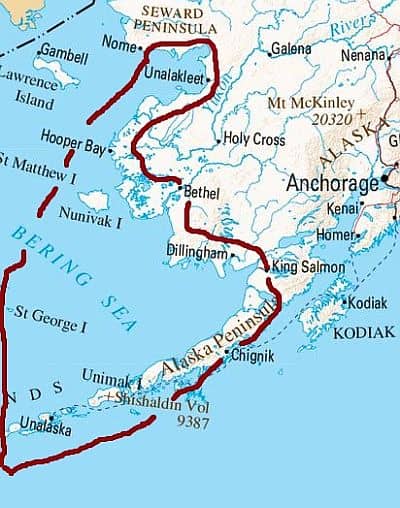
More to the south, the winter climate is less cold, while summer is still very cool, in fact, the average in July and August remains around 10 °C (50 °F).Precipitation increases progressively as one proceeds south.
In
Cape Newenham, the temperature is around -7 °C (19.5 °F) in January and 11 °C (52 °F) in July. Precipitation amounts to 930 mm (36.5 inches) per year, with a minimum between February and April and a maximum between July and October. Snow totals 2 meters (6.5 feet) per year, and usually falls from October to May.
Alaska Peninsula
The
Alaska Peninsula lies further to the south, so it has a milder winter, but the summer is still cold, so the vegetation is still tundra, that is, made of mosses and lichens.
In
Cold Bay, at 55 degrees north latitude, the average temperature ranges from -2 °C (28.5 °F) in January to 11.5 °C (53 °F) in August. Precipitation amounts to 1,085 mm (42.5 in) per year and is very frequent throughout the year, although a little more in autumn and a little less between spring and summer.
Here are the average temperatures.
Cold Bay - Average temperatures (1991-2020) | Month | Min (°C) | Max (°C) | Mean (°C) | Min (°F) | Max (°F) | Mean (°F) |
|---|
| January | -4.6 | 0.7 | -1.9 | 24 | 33 | 28.5 |
|---|
| February | -3.6 | 1.7 | -1 | 26 | 35 | 30.3 |
|---|
| March | -4.2 | 1.9 | -1.2 | 24 | 35 | 29.9 |
|---|
| April | -1.2 | 4.5 | 1.6 | 30 | 40 | 35 |
|---|
| May | 1.9 | 8.1 | 5 | 35 | 47 | 41 |
|---|
| June | 5.6 | 11.2 | 8.4 | 42 | 52 | 47.1 |
|---|
| July | 8.3 | 13.4 | 10.9 | 47 | 56 | 51.5 |
|---|
| August | 8.9 | 14 | 11.4 | 48 | 57 | 52.6 |
|---|
| September | 6.3 | 11.9 | 9.1 | 43 | 53 | 48.4 |
|---|
| October | 2.3 | 8 | 5.2 | 36 | 46 | 41.3 |
|---|
| November | -0.8 | 4.4 | 1.8 | 31 | 40 | 35.2 |
|---|
| December | -3.4 | 2 | -0.7 | 26 | 36 | 30.7 |
|---|
| Year | 1.3 | 6.8 | 4.05 | 34.4 | 44.3 | 39.5 |
|---|
In the central and western part of the Alaska Peninsula, typically the
sea does not freeze in winter, but sometimes it can do it, at least on the north coast and during the coldest winters. Here is the sea temperature in Cold Bay (which is located on the south coast).
Cold Bay - Sea temperature| Month | Celsius (°C) | Fahrenheit (°F) |
|---|
January | 4 | 39 | February | 3 | 37 | March | 2 | 36 | April | 3 | 37 | May | 4 | 39 | June | 7 | 45 | July | 9 | 48 | August | 11 | 52 | September | 10 | 50 | October | 8 | 46 | November | 6 | 43 | December | 5 | 41 | Year | 6 | 42.8 |
Aleutian Islands
The
Aleutian Islands are even milder, but they still have tundra vegetation because of their cold maritime climate, which is similar to that of Iceland. So, the climate here is cold but not too much in winter, with averages around 0/1 °C (32/34 °F) in the winter months, and very cool in summer, when the maximum temperatures are around 14/15 °C (57/59 °F). The wind often blows, especially from September to April, increasing the feeling of cold together with the humidity.
Here are the average temperatures of
Unalaska, the largest village in the Aleutians.
Unalaska - Average temperatures (1991-2020) | Month | Min (°C) | Max (°C) | Mean (°C) | Min (°F) | Max (°F) | Mean (°F) |
|---|
| January | -1.8 | 2.9 | 0.5 | 29 | 37 | 33 |
|---|
| February | -1.4 | 3.7 | 1.2 | 29 | 39 | 34.1 |
|---|
| March | -1.6 | 3.8 | 1.1 | 29 | 39 | 34 |
|---|
| April | 0.3 | 5.4 | 2.8 | 33 | 42 | 37.1 |
|---|
| May | 3 | 8.2 | 5.6 | 37 | 47 | 42.1 |
|---|
| June | 5.8 | 11.3 | 8.6 | 42 | 52 | 47.4 |
|---|
| July | 8.1 | 14.1 | 11.1 | 47 | 57 | 52 |
|---|
| August | 8.9 | 15.2 | 12 | 48 | 59 | 53.7 |
|---|
| September | 6.8 | 12.6 | 9.7 | 44 | 55 | 49.5 |
|---|
| October | 3.6 | 8.9 | 6.2 | 38 | 48 | 43.2 |
|---|
| November | 0.7 | 6.3 | 3.5 | 33 | 43 | 38.3 |
|---|
| December | -0.8 | 4.1 | 1.6 | 31 | 39 | 35 |
|---|
| Year | 2.7 | 8.1 | 5.35 | 36.8 | 46.5 | 41.5 |
|---|
Precipitation in the Aleutian Islands is abundant and frequent throughout the year, although it decreases somewhat in the summer, from June to August. During winter, heavy snowfalls occur. Here is the average precipitation in Unalaska.
Unalaska - Average precipitation| Month | Millimeters | Inches | Days |
|---|
| January | 170 | 6.7 | 22 |
|---|
| February | 130 | 5.1 | 19 |
|---|
| March | 120 | 4.7 | 19 |
|---|
| April | 90 | 3.5 | 18 |
|---|
| May | 105 | 4.1 | 18 |
|---|
| June | 65 | 2.6 | 15 |
|---|
| July | 60 | 2.4 | 14 |
|---|
| August | 75 | 3 | 15 |
|---|
| September | 145 | 5.7 | 20 |
|---|
| October | 200 | 7.9 | 25 |
|---|
| November | 170 | 6.7 | 22 |
|---|
| December | 200 | 7.9 | 23 |
|---|
| Year | 1525 | 60 | 231 |
|---|
Inland areas
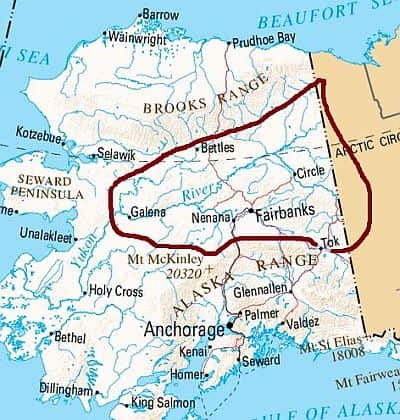
The vast
interior region of Alaska has a markedly continental climate, with frigid winters, and short but mild summers, during which there can be a few hot days. Here the dominant vegetation is taiga (coniferous forest).
The
cold records of Alaska (which contend with some areas of Canada those of the entire north American continent) have been set in this area, and in particular in the valleys of the Yukon River and its tributaries, where cold air during winter easily stagnates, especially after cold air outbreaks from Siberia or the North Pole. The temperature reached as low as -62 °C (-80 °F) in Prospect Creek, -59 °C (-74 °F) in McGrath and Chandalar Lake, -57 °C (-71 °F) in Eagle and Tetlin, -56 °C (-69 °F) in Arctic Village and Bettles, and -52 °C (-62 °F) in Fairbanks.
Apart from the records, as mentioned above, the climate of this region is strongly continental, so much so that in winter, lows around -30 °C (-22 °F) are normal, while in
summer, from June to August, highs are usually around 20/22 °C (68/72 °F), but with peaks of more than 30 °C (86 °F). Nights remain generally cool, and sometimes they can be cold. It may seem incredible, but in central Alaska, sometimes the temperature can reach 35 °C (95 °F)!
In this area, the temperature rises above the freezing point around late April and drops again below it in October.
Fairbanks
Here are the average temperatures of
Fairbanks, the second largest city in Alaska, located in the center of the state, at 64 degrees north latitude.
Fairbanks - Average temperatures (1991-2020) | Month | Min (°C) | Max (°C) | Mean (°C) | Min (°F) | Max (°F) | Mean (°F) |
|---|
| January | -27.4 | -17.5 | -22.4 | -17 | 0 | -8.4 |
|---|
| February | -24 | -11.3 | -17.6 | -11 | 12 | 0.2 |
|---|
| March | -19.7 | -4 | -11.8 | -3 | 25 | 10.7 |
|---|
| April | -5.7 | 7.6 | 0.9 | 22 | 46 | 33.7 |
|---|
| May | 3.7 | 16.7 | 10.2 | 39 | 62 | 50.4 |
|---|
| June | 10.1 | 22.1 | 16.1 | 50 | 72 | 61 |
|---|
| July | 11.7 | 22.6 | 17.2 | 53 | 73 | 62.9 |
|---|
| August | 8.7 | 19.1 | 13.9 | 48 | 66 | 57 |
|---|
| September | 2.3 | 13 | 7.6 | 36 | 55 | 45.8 |
|---|
| October | -7.6 | 1.2 | -3.2 | 18 | 34 | 26.2 |
|---|
| November | -20 | -10.9 | -15.4 | -4 | 12 | 4.2 |
|---|
| December | -25 | -15.4 | -20.2 | -13 | 4 | -4.4 |
|---|
| Year | -7.7 | 3.7 | -2 | 18.2 | 38.6 | 28.5 |
|---|
in this area is not abundant, in fact, it ranges from 250 to 350 mm (10 to 13.5 inches) per year, with a relative maximum in summer due to the higher amount of heat, and therefore energy, available during this period. Here is the average precipitation in Fairbanks.
Fairbanks - Average precipitation| Month | Millimeters | Inches | Days |
|---|
| January | 15 | 0.6 | 4 |
|---|
| February | 13 | 0.5 | 4 |
|---|
| March | 10 | 0.4 | 3 |
|---|
| April | 9 | 0.3 | 2 |
|---|
| May | 14 | 0.5 | 4 |
|---|
| June | 38 | 1.5 | 7 |
|---|
| July | 58 | 2.3 | 9 |
|---|
| August | 53 | 2.1 | 9 |
|---|
| September | 34 | 1.4 | 6 |
|---|
| October | 19 | 0.8 | 6 |
|---|
| November | 19 | 0.7 | 5 |
|---|
| December | 14 | 0.6 | 5 |
|---|
| Year | 295 | 11.7 | 64 |
|---|
In inland areas, the
sun shines more often than on the coast, and from April to June, there are as high as 10/11 hours of sunshine per day. However, in late spring and summer, the days are very long. In Fairbanks, the white nights occur roughly from April 25 to August 17.
Here are the average sunshine hours per day in Fairbanks.
Fairbanks - Sunshine hours| Month | Average | Total |
|---|
January | 1.5 | 55 | February | 4 | 120 | March | 7 | 225 | April | 10 | 300 | May | 10.5 | 320 | June | 11 | 335 | July | 9 | 275 | August | 5.5 | 165 | September | 4 | 120 | October | 2.5 | 85 | November | 2.5 | 70 | December | 1 | 35 | Year | 5.8 | 2105 |
Mountainous areas
In the
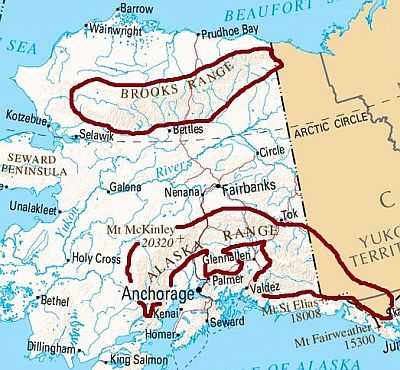
mountain regions, we find glaciers and permanent snow. The Alaska Range reaches its peak in Mount McKinley, towering with its 6,194 meters (20,321 feet). On the mountain slopes exposed to moist winds coming from the sea, every year large amounts of snow accumulate. Owing to both the facts that snowfalls are heavy and summers are cool, the snowline is very low, and in some areas, the glaciers, which tend to slide slowly downward because of their weight, flow even into the sea.
South Coast
Let us now talk about the
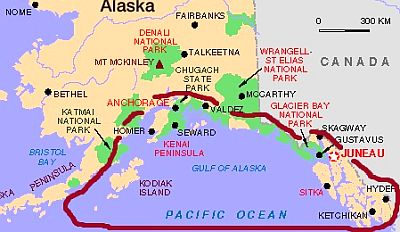
south coast of Alaska. Here, both the climate and the natural environment are similar to those of the west coast of Norway. In fact, here too a warm current flows in the sea, so much so that the water temperature doesn't drop below 6 °C (43 °F) even in winter. Therefore, there is a
cold maritime climate, with abundant rainfall (and snowfall in winter as well) on the coasts. In addition, here too there are islands (see the Kodiak and Alexander Archipelagos), fjords and deep coves, within which the climate is somewhat more continental and less humid.
Anchorage
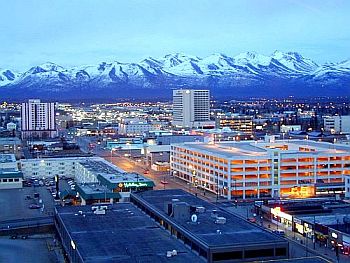
Anchorage is located at 61 degrees north latitude, in a sheltered bay, so much so that precipitation amounts to only 415 millimeters (16.5 inches) per year. Snow falls from October to April, and despite the low level of precipitation, the total amount of snow that falls in a year is close to 2 meters (6.5 feet). The daily average temperature ranges from -8.5 °C (16.5 °F) in January to 15.5 °C (59.5 °F) in July. Here are the average temperatures.
Anchorage - Average temperatures (1991-2020) | Month | Min (°C) | Max (°C) | Mean (°C) | Min (°F) | Max (°F) | Mean (°F) |
|---|
| January | -11.6 | -5.2 | -8.4 | 11 | 23 | 16.9 |
|---|
| February | -9.3 | -2.6 | -6 | 15 | 27 | 21.3 |
|---|
| March | -7.4 | 0.5 | -3.4 | 19 | 33 | 25.8 |
|---|
| April | -1.1 | 7.3 | 3.1 | 30 | 45 | 37.6 |
|---|
| May | 4.4 | 13.5 | 9 | 40 | 56 | 48.1 |
|---|
| June | 9.1 | 17.4 | 13.2 | 48 | 63 | 55.8 |
|---|
| July | 11.6 | 19 | 15.3 | 53 | 66 | 59.5 |
|---|
| August | 10.5 | 17.8 | 14.2 | 51 | 64 | 57.5 |
|---|
| September | 6.1 | 13.2 | 9.6 | 43 | 56 | 49.4 |
|---|
| October | -0.7 | 5.5 | 2.4 | 31 | 42 | 36.3 |
|---|
| November | -7.6 | -1.7 | -4.6 | 18 | 29 | 23.6 |
|---|
| December | -10.1 | -3.9 | -7 | 14 | 25 | 19.4 |
|---|
| Year | -0.5 | 6.8 | 3.15 | 31.2 | 44.2 | 37.5 |
|---|
In the areas directly exposed to ocean winds,
precipitation is particularly abundant. In the village of
Whittier, not far from Anchorage but on the other side of the Wrangell Mountains, precipitation amounts to 5,450 mm (215 in) per year, of which 633 cm (249 in) of snow. Further east,
Valdez is famous for being a very snowy city, in fact, up to 825 cm (27 feet) of snow fall per year. In the winter of 1989-1990, a total of 14 meters (46 feet) of snow was recorded! The snow is shoveled and piled in heaps as high as houses, which can last until July. Here, the average temperature in January is -5.5 °C (22 °F), while in July it's 13 °C (55.5 °F). Precipitation amounts to 1,700 mm (67 inches) per year, evenly distributed, but with a relative minimum in May and June.
Juneau
In
southeastern Alaska, at 58 degrees north latitude and west of the Canadian province of British Columbia, lies the state capital of Alaska,
Juneau. Here winters are cold, in fact, the January average is -2 °C (28.5 °F). Summers are cool, with highs in July of only 18 °C (64 °F). Here are the average temperatures.
Juneau - Average temperatures (1991-2020) | Month | Min (°C) | Max (°C) | Mean (°C) | Min (°F) | Max (°F) | Mean (°F) |
|---|
| January | -4.6 | 0.6 | -2 | 24 | 33 | 28.4 |
|---|
| February | -4.1 | 2 | -1 | 25 | 36 | 30.1 |
|---|
| March | -3 | 4 | 0.5 | 27 | 39 | 32.9 |
|---|
| April | 0.5 | 9.3 | 4.9 | 33 | 49 | 40.8 |
|---|
| May | 4.6 | 14.2 | 9.4 | 40 | 58 | 48.9 |
|---|
| June | 8.2 | 16.9 | 12.5 | 47 | 62 | 54.6 |
|---|
| July | 10.1 | 17.8 | 14 | 50 | 64 | 57.1 |
|---|
| August | 9.5 | 17.2 | 13.4 | 49 | 63 | 56 |
|---|
| September | 6.7 | 13.4 | 10 | 44 | 56 | 50.1 |
|---|
| October | 2.9 | 8.5 | 5.7 | 37 | 47 | 42.3 |
|---|
| November | -1.5 | 3.5 | 1 | 29 | 38 | 33.8 |
|---|
| December | -3.4 | 1.5 | -1 | 26 | 35 | 30.3 |
|---|
| Year | 2.2 | 9.1 | 5.65 | 36 | 48.4 | 42 |
|---|
In Juneau, precipitation is abundant, in fact, it is about 1,700 mm (67 inches) per year, with a peak from August to December. Snowfalls are abundant and occur from late October to early April, totaling 2.2 meters (88 inches) per year.
Juneau - Average precipitation| Month | Millimeters | Inches | Days |
|---|
| January | 153 | 6 | 17 |
|---|
| February | 109 | 4.3 | 14 |
|---|
| March | 93 | 3.7 | 14 |
|---|
| April | 88 | 3.5 | 14 |
|---|
| May | 89 | 3.5 | 13 |
|---|
| June | 97 | 3.8 | 13 |
|---|
| July | 130 | 5.1 | 15 |
|---|
| August | 163 | 6.4 | 16 |
|---|
| September | 232 | 9.1 | 20 |
|---|
| October | 214 | 8.4 | 20 |
|---|
| November | 166 | 6.5 | 18 |
|---|
| December | 166 | 6.5 | 17 |
|---|
| Year | 1700 | 67 | 191 |
|---|
The amount of sunshine in Juneau is not great, since the rains are frequent; nevertheless, the sunniest season, albeit slightly, is spring.
Juneau - Sunshine hours| Month | Average | Total |
|---|
January | 2.5 | 80 | February | 3 | 90 | March | 4.5 | 135 | April | 6 | 180 | May | 7.5 | 230 | June | 6.5 | 190 | July | 6 | 185 | August | 5 | 160 | September | 3.5 | 110 | October | 2 | 65 | November | 2 | 60 | December | 1.5 | 40 | Year | 4.2 | 1530 |
Ketchikan
While down to a certain latitude, precipitation occurs in the form of snow for many months, so much so that snow accumulation can be remarkable, the southernmost part is often
rainy even in winter. Here the climate is oceanic.
In
Ketchikan, the southernmost city of Alaska (it is located at 55 degrees north latitude), the average temperature is 2 °C (35.5 °F) in January and 15 °C (59 °F) in July and August. Here are the average temperatures.
Ketchikan - Average temperatures (1991-2020) | Month | Min (°C) | Max (°C) | Mean (°C) | Min (°F) | Max (°F) | Mean (°F) |
|---|
| January | -0.3 | 4.3 | 2 | 31 | 40 | 35.6 |
|---|
| February | -0.3 | 5 | 2.4 | 31 | 41 | 36.2 |
|---|
| March | 0.2 | 6.4 | 3.3 | 32 | 44 | 37.9 |
|---|
| April | 2.9 | 9.9 | 6.4 | 37 | 50 | 43.5 |
|---|
| May | 6.3 | 13.9 | 10.1 | 43 | 57 | 50.2 |
|---|
| June | 9.6 | 16.3 | 13 | 49 | 61 | 55.3 |
|---|
| July | 11.8 | 18 | 14.9 | 53 | 64 | 58.8 |
|---|
| August | 11.9 | 18.2 | 15 | 53 | 65 | 59.1 |
|---|
| September | 9.1 | 15 | 12 | 48 | 59 | 53.7 |
|---|
| October | 5.2 | 10.6 | 7.9 | 41 | 51 | 46.2 |
|---|
| November | 2 | 6.5 | 4.2 | 36 | 44 | 39.6 |
|---|
| December | 0.3 | 4.5 | 2.4 | 33 | 40 | 36.3 |
|---|
| Year | 4.9 | 10.8 | 7.8 | 40.9 | 51.4 | 46 |
|---|
In Ketchikan, precipitation amounts to almost 4 meters (13 feet) per year. Snow usually falls from November to March and totals "only" 1 meter (40 inches) per year, which is certainly not much compared to the huge amount of precipitation that occurs in the cold half of the year. Here is the average precipitation.
Ketchikan - Average precipitation| Month | Millimeters | Inches | Days |
|---|
| January | 411 | 16.2 | 20 |
|---|
| February | 300 | 11.8 | 15 |
|---|
| March | 279 | 11 | 19 |
|---|
| April | 260 | 10.2 | 17 |
|---|
| May | 220 | 8.7 | 14 |
|---|
| June | 178 | 7 | 13 |
|---|
| July | 186 | 7.3 | 13 |
|---|
| August | 287 | 11.3 | 14 |
|---|
| September | 363 | 14.3 | 18 |
|---|
| October | 467 | 18.4 | 21 |
|---|
| November | 434 | 17.1 | 22 |
|---|
| December | 413 | 16.3 | 20 |
|---|
| Year | 3800 | 149.5 | 205 |
|---|
Best Time
In general, the best season to visit Alaska is
summer, from June to August. It's cold along the northern and north-western coast, but at least the temperature is above freezing. It's very cool on the remaining western coasts and on the islands, with a daily average around 10 °C (50 °F). In inland areas, it's mild to warm during the day, and sometimes even hot, but at night it gets cool, and sometimes even cold. On the southern coast, where cities like Anchorage and Juneau are located, the air is mild, but if you take a boat trip (maybe to spot orcas and whales) or if you want to visit a glacier you must be equipped for the cold.
June is the best month in most of the country, except on the north coast, in fact, it's just cooler than July and August, but the sun shines more often, and rainy days occur more rarely. However, on the north coast, where normally it doesn't rain much, in July and August you can take advantage of a temperature a little higher (see the averages of Utqiagvik). It is worth while to recall that in Alaska the summer declines pretty quickly, so in July it usually rains more than in June, and in August more than in July.
During the
thaw (April in the south, May in inland areas, June on the northern coast), when snow turns into mud, it can be difficult to travel outside of towns and cities.
If you want to visit Alaska in its
winter appearance, February and March are preferable to December and January because the days are longer, in addition, these months are usually quite sunny in the central and northern regions.
What to pack in the suitcase
In
winter, it is necessary to bring clothing for extreme cold conditions, especially for the interior region, such as synthetic thermal long underwear, a fleece or synchilla, a down filled parka with insulated hood, a wind jacket in Goretex, warm boots, hand and foot warmers, gloves, fleece socks. For the south-east, you can bring less heavy clothes, a sweater, a down jacket, a rain jacket or umbrella.
In
summer, bring clothes for spring and autumn, a T-shirt for hot days, and a jacket and a sweater for the evening. When going to the north or the mountains, on a boat trip or on a glacier hike, you can bring warm clothes, a rain jacket, and a down jacket.
Back to topSee also the
temperatures by month.