![]() Climate chart - Gotland (Sweden)
Climate chart - Gotland (Sweden)
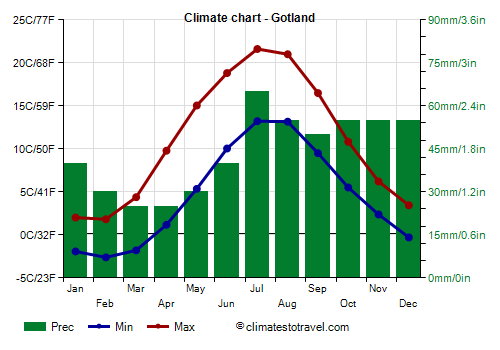
In Gotland, the largest Swedish island, the climate is
Baltic semi-continental, with cold winters and mild summers. The location on the sea makes the climate milder and sunnier than in the mainland, but also windier.
Here are the average temperatures in the main town, Visby.
Gotland - Average temperatures (1991-2020) | Month | Min (°C) | Max (°C) | Mean (°C) | Min (°F) | Max (°F) | Mean (°F) |
|---|
| January | -1.9 | 2 | 0.1 | 29 | 36 | 32.1 |
|---|
| February | -2.6 | 1.8 | -0.4 | 27 | 35 | 31.3 |
|---|
| March | -1.8 | 4.4 | 1.3 | 29 | 40 | 34.3 |
|---|
| April | 1.2 | 9.8 | 5.5 | 34 | 50 | 41.9 |
|---|
| May | 5.4 | 15 | 10.2 | 42 | 59 | 50.4 |
|---|
| June | 10 | 18.8 | 14.4 | 50 | 66 | 58 |
|---|
| July | 13.2 | 21.6 | 17.4 | 56 | 71 | 63.4 |
|---|
| August | 13.2 | 21 | 17.1 | 56 | 70 | 62.8 |
|---|
| September | 9.5 | 16.5 | 13 | 49 | 62 | 55.4 |
|---|
| October | 5.5 | 10.8 | 8.2 | 42 | 52 | 46.7 |
|---|
| November | 2.4 | 6.2 | 4.3 | 36 | 43 | 39.7 |
|---|
| December | -0.3 | 3.4 | 1.6 | 31 | 38 | 34.8 |
|---|
| Year | 4.5 | 11 | 7.75 | 40.1 | 51.8 | 46 |
|---|
is not abundant, since it amounts to 530 millimeters (20.9 inches) per year, but it is well distributed throughout the year. However, it is more frequent from October to January and less frequent from March to July. Here is the average precipitation.
Gotland - Average precipitation| Month | Millimeters | Inches | Days |
|---|
| January | 40 | 1.6 | 10 |
|---|
| February | 30 | 1.2 | 8 |
|---|
| March | 25 | 1 | 7 |
|---|
| April | 25 | 1 | 6 |
|---|
| May | 30 | 1.2 | 6 |
|---|
| June | 40 | 1.6 | 7 |
|---|
| July | 65 | 2.6 | 7 |
|---|
| August | 55 | 2.2 | 8 |
|---|
| September | 50 | 2 | 8 |
|---|
| October | 55 | 2.2 | 10 |
|---|
| November | 55 | 2.2 | 12 |
|---|
| December | 55 | 2.2 | 12 |
|---|
| Year | 530 | 20.9 | 101 |
|---|
, from December to March, is cold: the average temperature in January and February is around freezing (0 °C or 32 °F). Snowfalls are frequent, though usually not abundant.
During some periods, the temperature exceeds freezing, the snow melts and it can rain, but wind and humidity increase the feeling of cold.
During other periods, the temperature drops more significantly below freezing, though less than in the mainland. However, the coldest records are around -20/-22 °C (-4/-8 °F). The coldest record is -25.4 °C (-13.7 °F) and was set in February 1966.
In
spring, in April and May, the temperature increases rapidly. In April, cold days are still possible, with some snowfalls; by May, the daytime temperature becomes milder, but at night, it can still be cold. On the other hand, spring is a quite sunny season, and the days become very long, at least by mid-April.
Summer, from June to August, is mild: the maximum temperatures are typically about 21/22 °C (70/72 °F) in July and August. At night, it can get cold in June, and again in late August, but sometimes, the temperature can drop below 10 °C (50 °F) also in July and August. Some days can be very cool and rainy. There are also pleasantly warm and sunny periods, with highs about 26/27 °C (79/81 °F). In July 2010, the temperature reached as high as 33.7 °C (92.7 °F).
In
Autumn, from September to November, the temperature decreases rapidly, the days become shorter and the sun rarer. The rains are frequent, and in November, but sometimes also in late October, the first snowfalls occur.

The amount of
sunshine in Gotland is slightly better than in mainland Sweden, in fact there are 2,100 hours of sunshine per year, and as high as 10/11 hours per day from May to July. In winter, however, both because of the short days and because of the frequent periods of bad weather, the sun is rarely seen. Here are the average sunshine hours per day.
Gotland - Sunshine hours| Month | Average | Total |
|---|
January | 1 | 35 | February | 2.5 | 65 | March | 5.5 | 175 | April | 8.5 | 255 | May | 10 | 310 | June | 11 | 330 | July | 10 | 310 | August | 8 | 255 | September | 6.5 | 200 | October | 3.5 | 100 | November | 1.5 | 40 | December | 1 | 30 | Year | 5.8 | 2105 |
Given the latitude (57°38'N in the main town, Visby), the
white nights, in which the sun sets but it does not get completely dark even at midnight, occur from May 22 to July 21.
The
sea in Gotland is cold to swim in: the water temperature is still 12 °C (54 °F) in June, and reaches 17 °C (63 °F) in July and 18 °C (64 °F) in August. However, it doesn't seem to be a big problem for Swedes and tourists from other Nordic countries. Here are the average sea temperatures.
Gotland - Sea temperature| Month | Celsius (°C) | Fahrenheit (°F) |
|---|
January | 4 | 39 | February | 3 | 37 | March | 2.5 | 37 | April | 4 | 39 | May | 7 | 45 | June | 12 | 54 | July | 16.5 | 62 | August | 17.5 | 64 | September | 15 | 59 | October | 11 | 52 | November | 8 | 46 | December | 5.5 | 42 | Year | 8.9 | 48 |
Best Time
The
best time to visit the island of Gotland is the summer, from June to August, since it is the mildest of the year. June is cooler than July and August, but it's a bit less rainy and has longer days. Notwithstanding the fact that pleasant or even warm days in which you can sunbathe may occur, it's better to bring a sweatshirt or sweater, a light jacket and maybe an umbrella.
Gotland - Weather by month
Based on the period 1991-2020
January is generally a very cold month. The average temperature is of 0.0 °C (32 °F), with a minimum of -1.9 °C (28.5 °F) and a maximum of 2 °C (35.6 °F).

On the coldest nights of the month, the temperature usually drops to around -11.5 °C (11.5 °F). However, it dropped to -20.1 °C (-4.2 °F) in January 2006.

On the warmest days of the month, the temperature usually reaches around 6.5 °C (44 °F). However, it reached 10.2 °C (50.4 °F) in January 2005.

Precipitation amounts to 40 mm (1.6 in), distributed over 10 days.
The day lasts on average 7 hours and 25 minutes. So the days are short.

There is an average of 1 hour of sunshine per day. So, the sun shines 16% of the time.
The average humidity is 86%. Hence, the air is normally humid.
The average wind speed is 22 kph (14 mph).

The average sea temperature is of 4 °C (39 °F). Therefore, the sea is very cold for swimming.
February, the coldest month of the year, is generally a very cold month. The average temperature is of -0.4 °C (31 °F), with a minimum of -2.6 °C (27.3 °F) and a maximum of 1.8 °C (35.3 °F).
On the coldest nights of the month, the temperature usually drops to around -11 °C (12.5 °F). However, it dropped to -21.2 °C (-6.2 °F) in February 2012.
On the warmest days of the month, the temperature usually reaches around 7 °C (44 °F). However, it reached 11.2 °C (52.2 °F) in February 2002.
Precipitation amounts to 30 mm (1.2 in), distributed over 8 days.
The day lasts on average 9 hours and 30 minutes.
There are on average 2.5 hours of sunshine per day. So, the sun shines 24% of the time.
The average humidity is 85%. Hence, the air is normally humid.
The average wind speed is 21 kph (13 mph).
The average sea temperature is of 3 °C (37 °F). Therefore, the sea is very cold for swimming.
March is generally a cold month. The average temperature is of 1.3 °C (34 °F), with a minimum of -1.8 °C (28.8 °F) and a maximum of 4.4 °C (39.9 °F).
On the coldest nights, which normally occur at the beginning of the month, the temperature usually drops to around -10 °C (14 °F). However, it dropped to -19.5 °C (-3.1 °F) in March 2005.
On the warmest days, which normally occur at the end of the month, the temperature usually reaches around 11 °C (52 °F). However, it reached 16.1 °C (61 °F) in March 2007.
Precipitation amounts to 25 mm (1 in), distributed over 7 days.
The day lasts on average 11 hours and 55 minutes.
There are on average 5.5 hours of sunshine per day. So, the sun shines 47% of the time.
The average humidity is 80%. Hence, the air is normally humid.
The average wind speed is 19 kph (12 mph).
The average sea temperature is of 2.5 °C (37 °F). Therefore, the sea is very cold for swimming.
April is generally a quite cold month. The average temperature is of 5.5 °C (42 °F), with a minimum of 1.2 °C (34.1 °F) and a maximum of 9.8 °C (49.6 °F).
On the coldest nights, which normally occur at the beginning of the month, the temperature usually drops to around -5.5 °C (22.5 °F). However, it dropped to -8.7 °C (16.3 °F) in April 2013.
On the warmest days, which normally occur at the end of the month, the temperature usually reaches around 18.5 °C (65.5 °F). However, it reached 25.2 °C (77.4 °F) in April 2000.
Precipitation amounts to 25 mm (1 in), distributed over 6 days.
The day lasts on average 14 hours and 25 minutes.
There are on average 8.5 hours of sunshine per day. So, the sun shines 59% of the time.
The average humidity is 74%. Hence, the air is normally humid.
The average wind speed is 18 kph (11 mph).
The average sea temperature is of 4 °C (39 °F). Therefore, the sea is very cold for swimming.
May is generally a mild month. The average temperature is of 10.2 °C (50 °F), with a minimum of 5.4 °C (41.6 °F) and a maximum of 15 °C (59.1 °F).
On the coldest nights, which normally occur at the beginning of the month, the temperature usually drops to around -1.5 °C (29.5 °F). However, it dropped to -7.8 °C (18 °F) in May 2017.
On the warmest days, which normally occur at the end of the month, the temperature usually reaches around 23.5 °C (74.5 °F). However, it reached 27.7 °C (81.9 °F) in May 1995.
Precipitation amounts to 30 mm (1.2 in), distributed over 6 days.
The day lasts on average 16 hours and 40 minutes. So the days are long.
There are on average 10 hours of sunshine per day. So, the sun shines 60% of the time.
The average humidity is 71%. Hence, the air is normally humid.
The average wind speed is 16 kph (10 mph).
The average sea temperature is of 7 °C (45 °F). Therefore, the sea is very cold for swimming.
June is generally a mild month. The average temperature is of 14.4 °C (58 °F), with a minimum of 10 °C (50.1 °F) and a maximum of 18.8 °C (65.9 °F).
On the coldest nights, which normally occur at the beginning of the month, the temperature usually drops to around 4 °C (39 °F). However, it dropped to -0.3 °C (31.5 °F) in June 1991.
On the warmest days, which normally occur at the end of the month, the temperature usually reaches around 25.5 °C (78 °F). However, it reached 31.2 °C (88.2 °F) in June 1997.
Precipitation amounts to 40 mm (1.6 in), distributed over 7 days.
The day lasts on average 17 hours and 55 minutes. So the days are very long. June 21, the summer solstice, is the longest day of the year in the Northern Hemisphere.
There are on average 11 hours of sunshine per day. So, the sun shines 61% of the time.
The average humidity is 73%. Hence, the air is normally humid.
The average wind speed is 17 kph (10 mph).
The average sea temperature is of 12 °C (54 °F). Therefore, the sea is very cold for swimming.
July, the warmest month of the year, is generally a very mild month. The average temperature is of 17.4 °C (63 °F), with a minimum of 13.2 °C (55.8 °F) and a maximum of 21.6 °C (70.9 °F).
On the coldest nights of the month, the temperature usually drops to around 7.5 °C (45.5 °F). However, it dropped to 4.1 °C (39.4 °F) in July 2017.
On the warmest days of the month, the temperature usually reaches around 28 °C (82 °F). However, it reached 33.7 °C (92.7 °F) in July 2010.
Precipitation amounts to 65 mm (2.6 in), distributed over 7 days.
The day lasts on average 17 hours and 10 minutes. So the days are very long.
There are on average 10 hours of sunshine per day. So, the sun shines 58% of the time.
The average humidity is 75%. Hence, the air is normally humid.
The average wind speed is 16 kph (10 mph).
The average sea temperature is of 16.5 °C (62 °F). Therefore, the sea is cold for swimming.
August is generally a very mild month. The average temperature is of 17.1 °C (63 °F), with a minimum of 13.2 °C (55.7 °F) and a maximum of 21 °C (69.8 °F).
On the coldest nights of the month, the temperature usually drops to around 7 °C (44 °F). However, it dropped to 4.3 °C (39.7 °F) in August 2015.
On the warmest days of the month, the temperature usually reaches around 27 °C (80.5 °F). However, it reached 32.9 °C (91.2 °F) in August 2014.
Precipitation amounts to 55 mm (2.2 in), distributed over 8 days.
The day lasts on average 15 hours and 5 minutes. So the days are long.
There are on average 8 hours of sunshine per day. So, the sun shines 54% of the time.
The average humidity is 77%. Hence, the air is normally humid.
The average wind speed is 16 kph (10 mph).
The average sea temperature is of 17.5 °C (64 °F). Therefore, the sea is cold for swimming.
September is generally a mild month. The average temperature is of 13.0 °C (55 °F), with a minimum of 9.5 °C (49.1 °F) and a maximum of 16.5 °C (61.7 °F).
On the coldest nights, which normally occur at the end of the month, the temperature usually drops to around 3 °C (37 °F). However, it dropped to -2.9 °C (26.8 °F) in September 2001.
On the warmest days, which normally occur at the beginning of the month, the temperature usually reaches around 22 °C (72 °F). However, it reached 28.1 °C (82.6 °F) in September 2019.
Precipitation amounts to 50 mm (2 in), distributed over 8 days.
The day lasts on average 12 hours and 40 minutes.
There are on average 6.5 hours of sunshine per day. So, the sun shines 53% of the time.
The average humidity is 80%. Hence, the air is normally humid.
The average wind speed is 18 kph (11 mph).
The average sea temperature is of 15 °C (59 °F). Therefore, the sea is cold for swimming.
October is generally a quite mild month. The average temperature is of 8.2 °C (47 °F), with a minimum of 5.5 °C (41.9 °F) and a maximum of 10.8 °C (51.5 °F).
On the coldest nights, which normally occur at the end of the month, the temperature usually drops to around -2 °C (28.5 °F). However, it dropped to -6 °C (21.2 °F) in October 2005.
On the warmest days, which normally occur at the beginning of the month, the temperature usually reaches around 16 °C (60.5 °F). However, it reached 20.9 °C (69.6 °F) in October 2018.
Precipitation amounts to 55 mm (2.2 in), distributed over 10 days.
The day lasts on average 10 hours and 10 minutes.
There are on average 3.5 hours of sunshine per day. So, the sun shines 32% of the time.
The average humidity is 83%. Hence, the air is normally humid.
The average wind speed is 20 kph (12 mph).
The average sea temperature is of 11 °C (52 °F). Therefore, the sea is very cold for swimming.
November is generally a quite cold month. The average temperature is of 4.3 °C (40 °F), with a minimum of 2.4 °C (36.3 °F) and a maximum of 6.2 °C (43.2 °F).
On the coldest nights, which normally occur at the end of the month, the temperature usually drops to around -4.5 °C (24 °F). However, it dropped to -10.2 °C (13.6 °F) in November 2010.
On the warmest days, which normally occur at the beginning of the month, the temperature usually reaches around 10.5 °C (51 °F). However, it reached 13.5 °C (56.3 °F) in November 2014.
Precipitation amounts to 55 mm (2.2 in), distributed over 12 days.
The day lasts on average 8 hours and 0 minutes.
There are on average 1.5 hours of sunshine per day. So, the sun shines 17% of the time.
The average humidity is 87%. Hence, the air is normally humid.
The average wind speed is 20 kph (12 mph).
The average sea temperature is of 8 °C (46 °F). Therefore, the sea is very cold for swimming.
December is generally a cold month. The average temperature is of 1.6 °C (35 °F), with a minimum of -0.3 °C (31.5 °F) and a maximum of 3.4 °C (38.2 °F).
On the coldest nights of the month, the temperature usually drops to around -8.5 °C (17 °F). However, it dropped to -19.9 °C (-3.8 °F) in December 2001.
On the warmest days of the month, the temperature usually reaches around 7.5 °C (46 °F). However, it reached 12.5 °C (54.5 °F) in December 2015.
Precipitation amounts to 55 mm (2.2 in), distributed over 12 days.
The day lasts on average 6 hours and 40 minutes. So the days are short. December 21, the winter solstice, is the shortest day of the year in the Northern Hemisphere.
There is an average of 1 hour of sunshine per day. So, the sun shines 15% of the time.
The average humidity is 87%. Hence, the air is normally humid.
The average wind speed is 21 kph (13 mph).
The average sea temperature is of 5.5 °C (42 °F). Therefore, the sea is very cold for swimming.