Index
Introduction
In the Basque Country (
Euskadi in Basque, or
País Vasco in Spanish), an autonomous community in northern Spain, the climate is
cool and damp on the coast because of the influence of the Atlantic ocean, while in inland areas, it becomes colder with increasing altitude, and a little more continental (therefore warmer in summer) and more arid in the south.
Along the coast, the
wind blows frequently, in fact, there are beaches frequented by surfers.
Winter is quite mild on the coast, but cold air masses from the northeast can sometimes bring cold periods, when it can even snow, and night frosts may occur, typically light. This happens more easily in the eastern part of the coast (see San Sebastián) than in the west (see Bilbao).
Rainfall is quite abundant in the northern part of the Basque Country, where it typically exceeds 1,000 millimeters (40 inches) per year; in the central part, instead, it drops below 800 mm (31.5 in), and in the far south, where the landscape is much more arid, even below 500 mm (20 in). Summer is everywhere the least rainy season.
In the interior, we find hills and
mountains: the Basque Mountains, which are part of the Cantabrian Mountains, separate the cool and damp part of Spain from the arid plateau (
Meseta); the highest point is the
Aizkorri massif, which reaches 1,551 meters (5,089 feet).
The wind that comes down from the mountains can cause rapid increases in temperature due to the
föhn effect: in these cases, along the coast, the temperature can exceed 20 °C (68 °F) in winter, 30 °C (86 °F) in autumn and spring, and 35 °C (95 °F) in summer, when, however, this wind is rare.
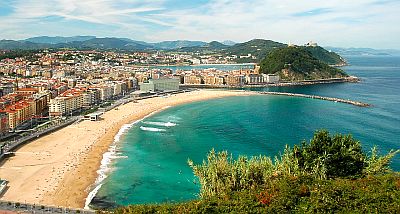
The coast, overlooking the Bay of Biscay (or Vizcaya) is indented, and characterized by cliffs that plunge into the sea and by caves, though there are also beaches.
On average, the amount of
sunshine in the Basque Country is never very good, at least in the northern and central part: in July and August, there are 6/7 hours of sunshine per day in Bilbao and San Sebastián, and 7/8 in Vitoria; in the other seasons, and especially in late autumn and winter, it is even worse, and the sky is often cloudy. On the contrary, in the south, in the valley of the Ebro, summer is sunny.
Here are the average daily sunshine hours in Bilbao.
Bilbao - Sunshine hours| Month | Average | Total |
|---|
January | 2.5 | 85 | February | 3.5 | 95 | March | 4.5 | 130 | April | 4.5 | 140 | May | 5.5 | 170 | June | 6 | 180 | July | 6 | 185 | August | 6 | 180 | September | 5.5 | 160 | October | 4 | 125 | November | 3 | 90 | December | 2.5 | 80 | Year | 4.4 | 1620 |
The cities
Bilbao
In the west, a short distance from the coast, we find
Bilbao: here, the monthly average temperature ranges from 9.5 °C (49 °F) in January to 21 °C (70 °F) in August; rainfall amounts to almost 1,200 mm (47 in) per year, with a maximum in November of 145 mm (5.7 in) and a minimum in July of 50 mm (2 in), when, however, there are quite frequent drizzles and short showers.
San Sebastian
In the eastern part of the coast, we find
San Sebastián. Here, the average temperature ranges from 8.5 °C (47.5 °F) in January to 20 °C (68 °F) in August. Although the winter temperatures are typically mild, as mentioned, this eastern part of the coast is more exposed to cold air outbreaks, and consequently, to snow and frost. In January 1985, the temperature dropped to -9 °C (16 °F), and in February 2012, to -5 °C (23 °F). In summer, although the temperatures are generally mild, there may be short heat waves. In August 2003, the temperatures reached 38.6 °C (101.5 °F).
Here are the average temperatures in the Igueldo station.
San Sebastian - Average temperatures (1991-2020) | Month | Min (°C) | Max (°C) | Mean (°C) | Min (°F) | Max (°F) | Mean (°F) |
|---|
| January | 6.2 | 11.1 | 8.6 | 43 | 52 | 47.6 |
|---|
| February | 6 | 11.6 | 8.8 | 43 | 53 | 47.8 |
|---|
| March | 7.7 | 13.6 | 10.6 | 46 | 56 | 51.2 |
|---|
| April | 8.8 | 15.1 | 12 | 48 | 59 | 53.5 |
|---|
| May | 11.4 | 18 | 14.7 | 53 | 64 | 58.5 |
|---|
| June | 14.2 | 20.3 | 17.2 | 58 | 69 | 63 |
|---|
| July | 16.3 | 22 | 19.2 | 61 | 72 | 66.5 |
|---|
| August | 16.8 | 22.9 | 19.8 | 62 | 73 | 67.7 |
|---|
| September | 14.9 | 21.2 | 18 | 59 | 70 | 64.5 |
|---|
| October | 12.6 | 18.6 | 15.6 | 55 | 65 | 60.1 |
|---|
| November | 9 | 14.1 | 11.6 | 48 | 57 | 52.8 |
|---|
| December | 7 | 11.9 | 9.4 | 45 | 53 | 49 |
|---|
| Year | 10.9 | 16.7 | 13.8 | 51.7 | 62.1 | 57 |
|---|
Rainfall in San Sebastián amounts to 1,500 mm (60 in) per year: we are in the wettest area of the coast. At the
Hondarribia airport, slightly further to the east and at the border with France, it reaches 1,650 mm (65 in). Summer is the least rainy season, but it still rains for 10/11 days per month, and the amount does not drop below 85 mm (3.3 in) in July.
Here is the average precipitation.
San Sebastian - Average precipitation| Month | Millimeters | Inches | Days |
|---|
| January | 140 | 5.5 | 13 |
|---|
| February | 110 | 4.3 | 12 |
|---|
| March | 115 | 4.5 | 12 |
|---|
| April | 140 | 5.5 | 14 |
|---|
| May | 120 | 4.7 | 12 |
|---|
| June | 90 | 3.5 | 11 |
|---|
| July | 85 | 3.3 | 10 |
|---|
| August | 115 | 4.5 | 11 |
|---|
| September | 110 | 4.3 | 10 |
|---|
| October | 160 | 6.3 | 12 |
|---|
| November | 170 | 6.7 | 13 |
|---|
| December | 150 | 5.9 | 13 |
|---|
| Year | 1510 | 59.4 | 142 |
|---|

In the
central part of the Basque Country, in the area called
Llanada Alavesa, the weather gets colder in winter and a bit warmer on summer days.
Vitoria-Gasteiz
In
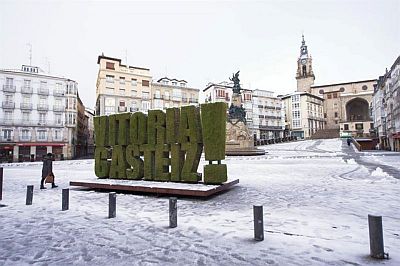
Vitoria-Gasteiz, the capital, located at 500 meters (1,600 feet) above sea level, winter is cold enough, but above all, the city is exposed to cold air invasions, which can produce snow and frost: on average, 11 days with snowfall per year occur, from November to April. In summer, the average temperatures are similar to those of the coast, although it can get hot with a higher frequency during the day, while nights are definitely cool.
Here are the average temperatures.
Vitoria Gasteiz - Average temperatures (1991-2020) | Month | Min (°C) | Max (°C) | Mean (°C) | Min (°F) | Max (°F) | Mean (°F) |
|---|
| January | 1 | 9.5 | 5.3 | 34 | 49 | 41.5 |
|---|
| February | 0.7 | 11.1 | 5.9 | 33 | 52 | 42.6 |
|---|
| March | 2.4 | 14.7 | 8.6 | 36 | 58 | 47.4 |
|---|
| April | 4.1 | 16.6 | 10.4 | 39 | 62 | 50.6 |
|---|
| May | 7 | 20.6 | 13.8 | 45 | 69 | 56.9 |
|---|
| June | 10.2 | 24.3 | 17.2 | 50 | 76 | 63 |
|---|
| July | 12.3 | 26.7 | 19.5 | 54 | 80 | 67.1 |
|---|
| August | 12.4 | 27.4 | 19.9 | 54 | 81 | 67.9 |
|---|
| September | 9.7 | 24.1 | 16.9 | 50 | 75 | 62.4 |
|---|
| October | 7.2 | 19.2 | 13.2 | 45 | 67 | 55.8 |
|---|
| November | 3.9 | 13.2 | 8.5 | 39 | 56 | 47.4 |
|---|
| December | 1.6 | 9.9 | 5.7 | 35 | 50 | 42.3 |
|---|
| Year | 6.1 | 18.2 | 12.1 | 42.9 | 64.7 | 54 |
|---|
Precipitation in Vitoria-Gasteiz amounts to 750 mm (29.5 in) per year; the rainiest month is November with 90 mm (3.5 in), while the driest are July, August and September with 40 mm (1.6 in).
Here is the average precipitation.
Vitoria Gasteiz - Average precipitation| Month | Millimeters | Inches | Days |
|---|
| January | 75 | 3 | 10 |
|---|
| February | 65 | 2.6 | 10 |
|---|
| March | 65 | 2.6 | 8 |
|---|
| April | 73 | 2.9 | 11 |
|---|
| May | 70 | 2.8 | 9 |
|---|
| June | 45 | 1.8 | 6 |
|---|
| July | 40 | 1.6 | 4 |
|---|
| August | 40 | 1.6 | 5 |
|---|
| September | 40 | 1.6 | 6 |
|---|
| October | 70 | 2.8 | 9 |
|---|
| November | 90 | 3.5 | 11 |
|---|
| December | 80 | 3.1 | 11 |
|---|
| Year | 750 | 29.5 | 100 |
|---|

In the
southern part of the Basque Country, in the Ebro Valley (the area called
Rioja Alavesa, see Laguardia), the climate acquires semi-continental characteristics, similar to those of the
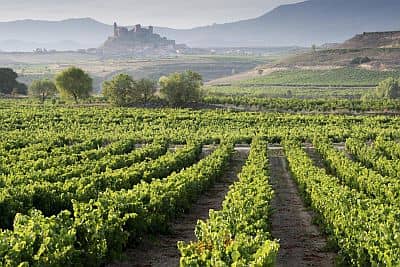
Meseta. In fact, it is semi-arid, since annual rainfall drops below 500 mm (20 in) per year; winters are quite cold, with a January average around 6.5 °C (43.5 °F); summers are hot, and there may be some scorching days, while nights remain pretty cool. It is an area renowned for its wine.
Logroño
Here are the average temperatures of Logroño, which is located in the same area, but on the south bank of the Ebro River, therefore in La Rioja province.
Logrono - Average temperatures (1991-2020) | Month | Min (°C) | Max (°C) | Mean (°C) | Min (°F) | Max (°F) | Mean (°F) |
|---|
| January | 2.2 | 10.4 | 6.3 | 36 | 51 | 43.3 |
|---|
| February | 2.3 | 12.3 | 7.3 | 36 | 54 | 45.2 |
|---|
| March | 4.5 | 16.2 | 10.4 | 40 | 61 | 50.7 |
|---|
| April | 6.5 | 18.6 | 12.5 | 44 | 65 | 54.6 |
|---|
| May | 9.8 | 22.9 | 16.4 | 50 | 73 | 61.4 |
|---|
| June | 13.5 | 27.6 | 20.5 | 56 | 82 | 69 |
|---|
| July | 15.7 | 30.4 | 23 | 60 | 87 | 73.5 |
|---|
| August | 15.8 | 30.5 | 23.2 | 60 | 87 | 73.7 |
|---|
| September | 12.9 | 26 | 19.4 | 55 | 79 | 67 |
|---|
| October | 9.2 | 20.5 | 14.9 | 49 | 69 | 58.7 |
|---|
| November | 5.4 | 14 | 9.7 | 42 | 57 | 49.4 |
|---|
| December | 2.8 | 10.5 | 6.6 | 37 | 51 | 44 |
|---|
| Year | 8.4 | 20 | 14.2 | 47.2 | 68.1 | 57.5 |
|---|
In Logroño, just 435 mm (17 in) of rain fall per year, with a maximum in April and May of 50 mm (2 in) and a minimum in August of 20 mm (0.8 in). Owing to the barrier formed by the aforementioned Basque Mountains, Atlantic currents arrive with difficulty in this area, so Autumn and winter are not very rainy.
Here is the average precipitation.
Logrono - Average precipitation| Month | Millimeters | Inches | Days |
|---|
| January | 30 | 1.2 | 6 |
|---|
| February | 25 | 1 | 6 |
|---|
| March | 30 | 1.2 | 5 |
|---|
| April | 50 | 2 | 8 |
|---|
| May | 50 | 2 | 9 |
|---|
| June | 45 | 1.8 | 6 |
|---|
| July | 30 | 1.2 | 4 |
|---|
| August | 20 | 0.8 | 4 |
|---|
| September | 25 | 1 | 4 |
|---|
| October | 40 | 1.6 | 7 |
|---|
| November | 45 | 1.8 | 7 |
|---|
| December | 40 | 1.6 | 7 |
|---|
| Year | 435 | 17.1 | 71 |
|---|

Sea temperature
The
sea in the Basque Country is very cool, if not a bit cold, even in summer, in fact, the water temperature at its highest, from July to September, is still around 21/22 °C (70/72 °F), as you can see in the sea temperature near Bilbao.
Bilbao - Sea temperature| Month | Celsius (°C) | Fahrenheit (°F) |
|---|
January | 13 | 55 | February | 12.5 | 54 | March | 12.5 | 55 | April | 13 | 56 | May | 15 | 59 | June | 18.5 | 65 | July | 21 | 69 | August | 21.5 | 71 | September | 20.5 | 69 | October | 18 | 65 | November | 15.5 | 60 | December | 14 | 57 | Year | 16.3 | 61.4 |
Best Time
The
best time to visit the Basque Country, at least the center-north, is the summer, from June to August or the first half of September, since it is the driest and sunniest period of the year. July and August are the warmest and least rainy months. Even in midsummer, you must take into account some rain, and some nights a bit cool on the coast, and a bit cold in central inland areas.
In summer, in good weather (which is not very frequent), you can take a break at the beach and sunbathe, with an air temperature often pleasant and a cool breeze from the ocean, although, as I said, the sea is a bit cold for swimming.
In the south, in the Ebro valley, which can be very hot in summer, you can go in spring and autumn, especially in May and from mid-September to mid-October, although the rains are more frequent; in autumn, the landscape occupied by vast vineyards shows spectacular colors.
Back to topSee also the
temperatures by month.