Select units of measurement for the temperature and rainfall tables (metric or imperial).
Average weather, temperature, rainfall, sunshine
Saint Lucia, an island of the Lesser Antilles belonging to the Commonwealth, has a
tropical climate, hot all year round, with a relatively cool, dry season from January to mid-April and a hot, humid and rainy season from mid-June to November.
In the former period, the
northeast trade winds, constant winds typical of tropical climates, blow steadily and with moderate intensity, while in the latter period, these winds are more irregular, and may have some breaks, increasing the feeling of sultriness. Between them, there are
two transitional periods: from December to early January (when the northeast wind starts to blow, the temperature decreases a bit, and the weather improves) and from mid-April to Mid-June (when both the temperature and the frequency of downpours gradually increase).
Rainfall in Saint Lucia varies depending on altitude and location; in fact, the inland elevations receive more rainfall than the coast, and the areas closest to the mountains are rainier than the more distant ones. However, the rains follow the same pattern, and are
more frequent and abundant from July to November and less frequent and shorter from February to April.
On the coast, rainfall ranges from about 1,500 millimeters (59 in) per year on the southern tip, to about 2,000 mm (78 in) per year on the north-eastern part.
In inland areas, on the slopes of
Mount Gimie, 950 meters (3,120 feet) high, the rains are even more abundant, in fact, they are covered with rainforests.
The climate in detail
The cities
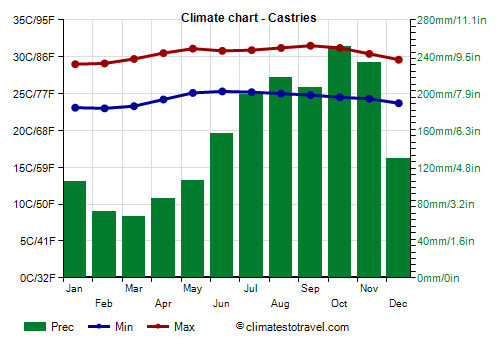
Castries

In
Castries, the capital, located on the northwestern coast, the average temperature fluctuates between around 26 °C (79 °F) in January and February, to around 28 °C (82.5 °F) from May to October. As you can see, there are little variations between the coolest and the warmest period.
Rainfall amounts to 1,830 mm (72 in) per year, of which more than 150 mm (6 in) per month from June to November.
Throughout the year, the rains occur especially in the form of downpours or thunderstorms, which could be intense, but generally do not last long, so they do not reduce too much the
sunshine hours. Sometimes, however, there may be a more intense wave of bad weather.
In fact, the amount of sunshine is good all year round, at least along the coasts.
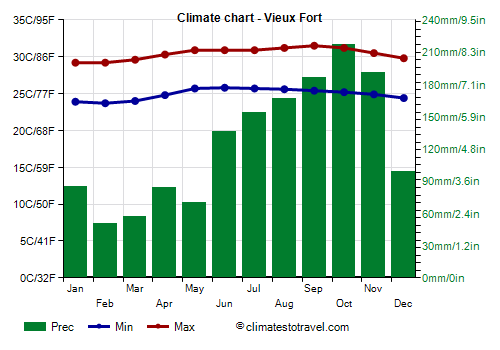
Vieux Fort

In
Vieux Fort, which is located on the south coast, in the driest point, 1,500 mm (59 inches) of rain fall per year, of which more than 100 mm (4 in) fall per month from July to December. The least rainy months are February and March, with approximately 50/55 mm (2/2.2 in) per month on average.

Sea temperature
The
sea in Saint Lucia is warm enough to swim in throughout the year: the water temperature ranges from 27 °C (80.5 °F) from January to March, to 29 °C (84 °F) in September and October.
Hurricanes
Saint Lucia can be affected by tropical storms and cyclones, called
hurricanes in the Caribbean area, which may pass over the island from June to November, though they are most likely from August to October. A hurricane that caused serious damage to the island was Allen in August 1980.
When to go
The best time to visit Saint Lucia is
from December to April, since it is the coolest and the least rainy period of the year, and especially from February to April, which is the dryest of all.
What to pack
All year round: bring
light clothes of natural fabric, and possibly a light sweatshirt and a light raincoat for thunderstorms. You can add a light sweatshirt for the evening from December to February.
When going to the reef, you can bring snorkeling equipment, including water shoes or rubber-soled shoes.
Climate data - Saint Lucia
| Castries |
|---|
|
| Jan | Feb | Mar | Apr | May | Jun | Jul | Aug | Sep | Oct | Nov | Dec |
|---|
| Min temp. | 23 | 23 | 23 | 24 | 25 | 25 | 25 | 25 | 25 | 24 | 24 | 24 |
|---|
| Max temp. | 29 | 29 | 30 | 30 | 31 | 31 | 31 | 31 | 32 | 31 | 30 | 30 |
|---|
| Precip. | 105 | 70 | 65 | 85 | 105 | 155 | 200 | 220 | 205 | 250 | 235 | 130 |
|---|
| Prec. days | 17 | 12 | 12 | 11 | 12 | 16 | 20 | 19 | 16 | 18 | 19 | 16 |
|---|
| Humidity | 74% | 72% | 71% | 72% | 73% | 75% | 76% | 76% | 76% | 77% | 78% | 75% |
|---|
| Day length | 11 | 12 | 12 | 12 | 13 | 13 | 13 | 13 | 12 | 12 | 12 | 11 |
|---|
| Sun hours | 8 | 8 | 8 | 8 | 8 | 8 | 8 | 8 | 8 | 7 | 8 | 8 |
|---|
| Sea temp | 27 | 27 | 27 | 27 | 28 | 28 | 28 | 29 | 29 | 29 | 28 | 28 |
|---|
| Vieux Fort |
|---|
|
| Jan | Feb | Mar | Apr | May | Jun | Jul | Aug | Sep | Oct | Nov | Dec |
|---|
| Min temp. | 24 | 24 | 24 | 25 | 26 | 26 | 26 | 26 | 25 | 25 | 25 | 24 |
|---|
| Max temp. | 29 | 29 | 30 | 30 | 31 | 31 | 31 | 31 | 32 | 31 | 30 | 30 |
|---|
| Precip. | 85 | 50 | 55 | 85 | 70 | 135 | 155 | 165 | 185 | 215 | 190 | 100 |
|---|
| Prec. days | 13 | 10 | 9 | 9 | 10 | 14 | 18 | 17 | 14 | 16 | 16 | 14 |
|---|
| Humidity | 74% | 73% | 73% | 74% | 75% | 77% | 78% | 78% | 78% | 79% | 79% | 75% |
|---|
| Day length | 11 | 12 | 12 | 12 | 13 | 13 | 13 | 12 | 12 | 12 | 12 | 11 |
|---|
|
| Sea temp | 27 | 27 | 27 | 27 | 28 | 28 | 28 | 29 | 29 | 29 | 28 | 28 |
|---|