Select units of measurement for the temperature and rainfall tables (metric or imperial).
Average weather, temperature, rainfall, sunshine hours

Ulyanovsk has a
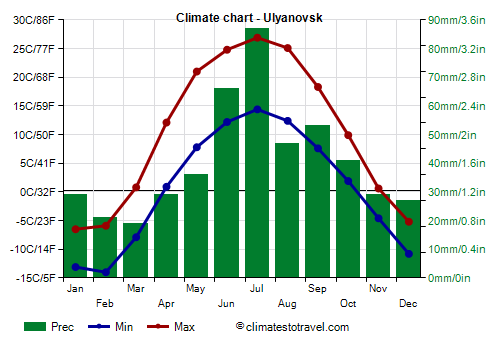
continental climate, with cold winters, during which the temperature is normally below freezing, and warm summers.
Ulyanovsk (formerly Simbirsk) is a city of 320,000 inhabitants, the capital of the oblast of the same name, located in European Russia, at 54 degrees north latitude and 710 km (440 mi) east-southeast of Moscow.
The Volga, the longest river in Europe, in this area is particularly wide, even 25 km (15 mi), since downstream, near the city of Togliatti, a dam was built that created the Kuibyshev reservoir (the former name of Samara).
Precipitation is not abundant, since it amounts to about 485 millimeters (19 inches) per year. As often happens in cold climates, the rainiest season is summer.
Winter, from November to March, is very cold: the average temperature in January and February is about -10 °C (14 °F). The sky is often cloudy, and light snow often falls.
During
cold waves, the temperature can drop below -30 °C (-22 °F).
Occasionally, it has dropped below -40 °C (-40 °F).
In February 1954, the monthly daily mean was -23 °C (-9.5 °F).
Summer, from June to August, is warm and sunny enough. The average in July is around 20.5 °C (69 °F).
Sometimes there can be
heat waves, during which the temperature can reach, and more rarely exceed, 35 °C (95 °F), and which can be interrupted by strong thunderstorms and gusts of wind. During the exceptional summer of 2010, the temperature reached 38.9 °C (102 °F) in July, when the average maximum was 31.8 °C (89.2 °F), and 39.3 °C (102.7 °F) in August.
Ulyanovsk - Climate data
In Ulyanovsk, the
average temperature of the coldest month (February) is of
-10 °C, that of the warmest month (July) is of
20.6 °C. Here are the average temperatures.
Ulyanovsk - Average temperatures (1991-2020) |
| Month | Min | Max | Mean |
|---|
| January | -13.1 | -6.5 | -9.8 |
|---|
| February | -14 | -5.9 | -10 |
|---|
| March | -7.9 | 0.8 | -3.6 |
|---|
| April | 0.9 | 12.1 | 6.5 |
|---|
| May | 7.8 | 21 | 14.4 |
|---|
| June | 12.2 | 24.8 | 18.5 |
|---|
| July | 14.4 | 26.9 | 20.6 |
|---|
| August | 12.4 | 25.1 | 18.8 |
|---|
| September | 7.6 | 18.3 | 13 |
|---|
| October | 1.9 | 9.9 | 5.9 |
|---|
| November | -4.6 | 0.6 | -2 |
|---|
| December | -10.8 | -5.2 | -8 |
|---|
| Year | 0.6 | 10.2 | 5.45 |
|---|
amounts to
485 millimeters per year: it is therefore quite scarce. It ranges from
19 millimeters in the driest month (March) to
87 millimeters in the wettest one (July). Here is the average precipitation.
Ulyanovsk - Average precipitation| Month | Days |
|---|
| January | 29 | 7 |
|---|
| February | 21 | 6 |
|---|
| March | 19 | 5 |
|---|
| April | 29 | 5 |
|---|
| May | 36 | 6 |
|---|
| June | 66 | 10 |
|---|
| July | 87 | 9 |
|---|
| August | 47 | 7 |
|---|
| September | 53 | 9 |
|---|
| October | 41 | 8 |
|---|
| November | 29 | 7 |
|---|
| December | 27 | 7 |
|---|
| Year | 485 | 86 |
|---|
There are on average around 2030
sunshine hours per year. Here are the average hours of sunshine per day.
Ulyanovsk - Sunshine hours| Month | Average | Total |
|---|
| January | 1.5 | 45 |
|---|
| February | 3.5 | 95 |
|---|
| March | 4.5 | 145 |
|---|
| April | 7 | 215 |
|---|
| May | 9 | 275 |
|---|
| June | 10 | 300 |
|---|
| July | 10.5 | 320 |
|---|
| August | 9 | 275 |
|---|
| September | 6 | 175 |
|---|
| October | 3.5 | 100 |
|---|
| November | 1.5 | 50 |
|---|
| December | 1 | 35 |
|---|
| Year | 5.6 | 2030 |
|---|