Select units of measurement for the temperature and rainfall tables (metric or imperial).
Average weather, temperature, rainfall, sunshine hours

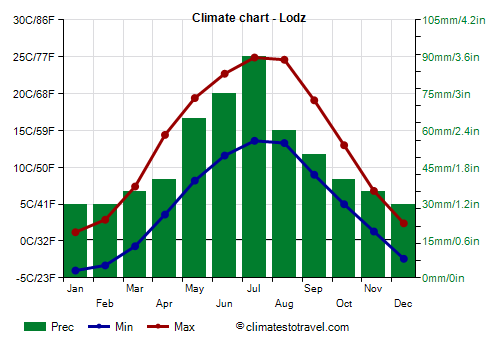
The climate of Łódź is
moderately continental, characterized by cold winters, with temperatures often below freezing (0 °C or 32 °F), and pleasantly warm summers.
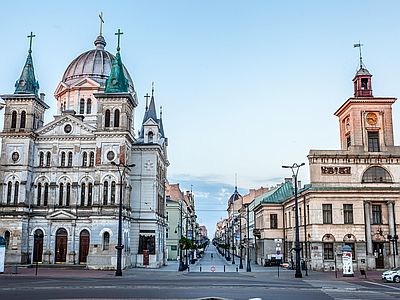
Lodz is Poland's third largest city and is located in the center of the country, in the Łódź Voivodeship, and southwest of Warsaw.
Winter is cold and gray. Snowfalls are frequent, but generally not abundant.
Sometimes, cold waves from Siberia can occur, and the temperatures can drop to -20 °C (-4 °F) or below. The coldest record is -31 °C (-23.8 °F) and was set in January 1963.
In
summer, the temperatures are pleasant and suitable for outdoor activities, although sometimes there can be rains and thunderstorms.
Every now and then (and more often in recent years due to global warming), there can be short heat waves, with maximum temperatures exceeding 30 °C (86 °F). The highest record is 37.6 °C (99.7 °F) and was set in August 1994.

Best Time
The
best time to visit Łódź runs from mid-May to mid-September, since it is the warmest and sunniest period of the year. Sometimes, it can be hot in July and August, while in other circumstances, nights can be cool or even a little cold even in these months, so it can be useful to bring a sweatshirt or sweater and a light jacket for the evening.
Lodz - Climate data
In Lodz, the
average temperature of the coldest month (January) is of
-1.4 °C, that of the warmest month (July) is of
19.2 °C. Here are the average temperatures.
Lodz - Average temperatures (1991-2020) |
| Month | Min | Max | Mean |
|---|
| January | -4 | 1.2 | -1.4 |
|---|
| February | -3.3 | 2.9 | -0.2 |
|---|
| March | -0.7 | 7.4 | 3.4 |
|---|
| April | 3.6 | 14.4 | 9 |
|---|
| May | 8.2 | 19.4 | 13.8 |
|---|
| June | 11.6 | 22.7 | 17.2 |
|---|
| July | 13.6 | 24.9 | 19.2 |
|---|
| August | 13.3 | 24.6 | 19 |
|---|
| September | 9 | 19.1 | 14 |
|---|
| October | 5 | 13 | 9 |
|---|
| November | 1.3 | 6.8 | 4 |
|---|
| December | -2.4 | 2.4 | 0 |
|---|
| Year | 4.6 | 13.3 | 8.95 |
|---|
amounts to
580 millimeters per year: so, it is at an intermediate level. It ranges from
30 millimeters in the driest months (January, February, December) to
90 millimeters in the wettest one (July). Here is the average precipitation.
Lodz - Average precipitation| Month | Days |
|---|
| January | 30 | 8 |
|---|
| February | 30 | 7 |
|---|
| March | 35 | 8 |
|---|
| April | 40 | 7 |
|---|
| May | 65 | 10 |
|---|
| June | 75 | 9 |
|---|
| July | 90 | 11 |
|---|
| August | 60 | 8 |
|---|
| September | 50 | 8 |
|---|
| October | 40 | 8 |
|---|
| November | 35 | 8 |
|---|
| December | 30 | 8 |
|---|
| Year | 580 | 99 |
|---|
There are on average around 1770
sunshine hours per year. Here are the average hours of sunshine per day.
Lodz - Sunshine hours| Month | Average | Total |
|---|
| January | 1.5 | 50 |
|---|
| February | 2.5 | 65 |
|---|
| March | 4 | 125 |
|---|
| April | 6 | 185 |
|---|
| May | 8 | 240 |
|---|
| June | 8 | 245 |
|---|
| July | 8 | 250 |
|---|
| August | 8 | 245 |
|---|
| September | 5.5 | 160 |
|---|
| October | 3.5 | 110 |
|---|
| November | 1.5 | 50 |
|---|
| December | 1.5 | 40 |
|---|
| Year | 4.8 | 1770 |
|---|