![]() Climate chart - Miyakojima (Japan)
Climate chart - Miyakojima (Japan)
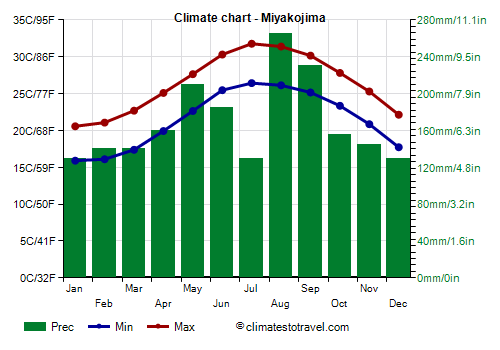
The climate of Miyako-jima is
sub-tropical, with very mild winters and long, moist and rainy summers.
Miyako-jima is the most important island of the archipelago of the same name (
Miyako Islands), which is located to the east of Taiwan, and administratively is part of Okinawa prefecture. Other islands of the Miyako archipelago are Irabu, Minna, Tarama, Kurima, Ikema, Ogami, and Shimoji. Together with the Yaeyama Islands (see
Ishigaki), the Miyako Islands are part of the Sakishima Islands, in their turn belonging to the southern Ryukyus. The latitude of these islands is very low, a bit to the north of the Tropic of Cancer. Near the islands is a coral reef.
Here are the average
temperatures.
Miyakojima - Average temperatures (1991-2020) | Month | Min (°C) | Max (°C) | Mean (°C) | Min (°F) | Max (°F) | Mean (°F) |
|---|
| January | 15.9 | 20.6 | 18.2 | 61 | 69 | 64.8 |
|---|
| February | 16.1 | 21.1 | 18.6 | 61 | 70 | 65.5 |
|---|
| March | 17.4 | 22.7 | 20 | 63 | 73 | 68.1 |
|---|
| April | 19.9 | 25.1 | 22.5 | 68 | 77 | 72.5 |
|---|
| May | 22.6 | 27.6 | 25.1 | 73 | 82 | 77.3 |
|---|
| June | 25.5 | 30.3 | 27.9 | 78 | 87 | 82.2 |
|---|
| July | 26.4 | 31.8 | 29.1 | 80 | 89 | 84.4 |
|---|
| August | 26.1 | 31.4 | 28.8 | 79 | 89 | 83.8 |
|---|
| September | 25.2 | 30.2 | 27.7 | 77 | 86 | 81.8 |
|---|
| October | 23.4 | 27.8 | 25.6 | 74 | 82 | 78 |
|---|
| November | 20.9 | 25.3 | 23.1 | 70 | 78 | 73.5 |
|---|
| December | 17.7 | 22.1 | 19.9 | 64 | 72 | 67.9 |
|---|
| Year | 21.5 | 26.4 | 23.85 | 70.6 | 79.4 | 75 |
|---|
Although the
winter is very mild, the sky is often cloudy, and periods of bad weather, with wind and rain, are quite common. Every now and then, especially in January, there can be very cool days, with highs around 16 °C (61 °F) or less and lows around 10 °C (50 °F) or less. In January 2016, there was a day with a minimum of 8 °C (46 °F) and a maximum of 10.5 °C (51 °F).
The long
summer is muggy, with quite frequent and sometimes abundant rains. The first part of the rainy season, called plum rains (
Baiu), begins one month earlier than on the main islands of Japan, so it occurs in May and June, however, between one shower and another, the sun can come out, especially in June. In July, there is a relative pause, so the rains decrease and sunshine becomes pretty frequent.
Here are the average daily sunshine hours.
Miyakojima - Sunshine hours| Month | Average | Total |
|---|
January | 3 | 85 | February | 3 | 85 | March | 3.5 | 110 | April | 4 | 125 | May | 5 | 150 | June | 6.5 | 190 | July | 8 | 245 | August | 7 | 220 | September | 6 | 185 | October | 5 | 155 | November | 3.5 | 110 | December | 3.5 | 100 | Year | 4.8 | 1765 |
In the second part of summer (August, September and early October), the rains increase again, but the amount of sunshine remains generally decent, at least until September. If all goes well, a week can pass without rain, otherwise, there may be periods of bad weather, or even typhoons.
In fact, from June to October, with a peak from August to early October, Miyako can be affected by
typhoons, the tropical cyclones of Southeast Asia, which can bring strong winds and torrential rains.
Here is the average precipitation.
Miyakojima - Average precipitation| Month | Millimeters | Inches | Days |
|---|
| January | 130 | 5.1 | 19 |
|---|
| February | 140 | 5.5 | 17 |
|---|
| March | 140 | 5.5 | 18 |
|---|
| April | 160 | 6.3 | 16 |
|---|
| May | 210 | 8.3 | 18 |
|---|
| June | 185 | 7.3 | 18 |
|---|
| July | 130 | 5.1 | 17 |
|---|
| August | 265 | 10.4 | 19 |
|---|
| September | 230 | 9.1 | 17 |
|---|
| October | 155 | 6.1 | 17 |
|---|
| November | 145 | 5.7 | 18 |
|---|
| December | 130 | 5.1 | 19 |
|---|
| Year | 2020 | 79.5 | 213 |
|---|

The
sea in Miyako is never cold, in fact, the water temperature reaches a minimum of 23 °C (73 °F) in January and February, so if you want, you can try to swim even in winter, while it becomes very warm in summer. Here are the average sea temperatures.
Miyakojima - Sea temperature| Month | Celsius (°C) | Fahrenheit (°F) |
|---|
January | 23 | 73 | February | 23 | 73 | March | 24 | 75 | April | 25 | 77 | May | 26 | 79 | June | 28 | 82 | July | 29 | 84 | August | 29 | 84 | September | 29 | 84 | October | 28 | 82 | November | 26 | 79 | December | 25 | 77 | Year | 26.3 | 79.3 |
Best Time
It is difficult to find the best time to visit Miyakojima, because there is no dry and sunny period. However, in general you can choose the period from November to April. A typhoon can still pass until mid-November, although this happens rarely and with generally modest effects. From mid-December to mid-March, there can be cool days, with highs of 15 °C (59 °F) or less.
Since there is a pause between the two rainy periods (May-June and August-September), in Miyakojima the best month for a beach holiday is July, though afternoon thunderstorms are still possible, in addition to the passage of tropical storms and typhoons over the island.
Miyakojima - Weather by month
Based on the period 1991-2020
January, the coldest month of the year, is generally a warm month. The average temperature is of 18.2 °C (65 °F), with a minimum of 15.9 °C (60.6 °F) and a maximum of 20.6 °C (69 °F).

On the coldest nights of the month, the temperature usually drops to around 11.5 °C (53 °F). However, it dropped to 7.5 °C (45.5 °F) in January 2016.

On the warmest days of the month, the temperature usually reaches around 25 °C (77 °F). However, it reached 27 °C (80.6 °F) in January 2020.

Precipitation amounts to 130 mm (5.1 in), distributed over 19 days.
The day lasts on average 10 hours and 50 minutes.

There are on average 3 hours of sunshine per day. So, the sun shines 26% of the time.
The average humidity is 71%. Hence, the air is normally humid.
The average wind speed is 18 kph (11 mph).

The average sea temperature is of 23 °C (73.5 °F). Therefore, the sea can be considered barely acceptable for swimming.
February is generally a warm month. The average temperature is of 18.6 °C (65 °F), with a minimum of 16.1 °C (61 °F) and a maximum of 21.1 °C (69.9 °F).
On the coldest nights of the month, the temperature usually drops to around 12 °C (54 °F). However, it dropped to 9 °C (48.2 °F) in February 2016.
On the warmest days of the month, the temperature usually reaches around 25.5 °C (78.5 °F). However, it reached 27.6 °C (81.7 °F) in February 2010.
Precipitation amounts to 140 mm (5.5 in), distributed over 17 days.
The day lasts on average 11 hours and 20 minutes.
There are on average 3 hours of sunshine per day. So, the sun shines 26% of the time.
The average humidity is 73%. Hence, the air is normally humid.
The average wind speed is 17 kph (11 mph).
The average sea temperature is of 23 °C (73.5 °F). Therefore, the sea can be considered barely acceptable for swimming.
March is generally a warm month. The average temperature is of 20.0 °C (68 °F), with a minimum of 17.4 °C (63.3 °F) and a maximum of 22.7 °C (72.8 °F).
On the coldest nights, which normally occur at the beginning of the month, the temperature usually drops to around 13 °C (55.5 °F). However, it dropped to 9.2 °C (48.6 °F) in March 2005.
On the warmest days, which normally occur at the end of the month, the temperature usually reaches around 27 °C (80.5 °F). However, it reached 28.6 °C (83.5 °F) in March 1998.
Precipitation amounts to 140 mm (5.5 in), distributed over 18 days.
The day lasts on average 12 hours and 0 minutes.
There are on average 3.5 hours of sunshine per day. So, the sun shines 30% of the time.
The average humidity is 75%. Hence, the air is normally humid.
The average wind speed is 17 kph (10 mph).
The average sea temperature is of 24 °C (75 °F). Therefore, the sea is warm enough for swimming.
April is generally a warm month. The average temperature is of 22.5 °C (73 °F), with a minimum of 19.9 °C (67.9 °F) and a maximum of 25.1 °C (77.2 °F).
On the coldest nights, which normally occur at the beginning of the month, the temperature usually drops to around 15.5 °C (59.5 °F). However, it dropped to 10 °C (50 °F) in April 1993.
On the warmest days, which normally occur at the end of the month, the temperature usually reaches around 28.5 °C (83.5 °F). However, it reached 30.2 °C (86.4 °F) in April 2019.
Precipitation amounts to 160 mm (6.3 in), distributed over 16 days.
The day lasts on average 12 hours and 50 minutes.
There are on average 4 hours of sunshine per day. So, the sun shines 32% of the time.
The average humidity is 79%. Hence, the air is normally humid.
The average wind speed is 16 kph (10 mph).
The average sea temperature is of 25 °C (77 °F). Therefore, the sea is warm enough for swimming.
May is generally a warm to hot, muggy month. The average temperature is of 25.1 °C (77 °F), with a minimum of 22.6 °C (72.8 °F) and a maximum of 27.6 °C (81.8 °F).
On the coldest nights, which normally occur at the beginning of the month, the temperature usually drops to around 19 °C (66.5 °F). However, it dropped to 16 °C (60.8 °F) in May 2013.
On the warmest days, which normally occur at the end of the month, the temperature usually reaches around 30.5 °C (87 °F). However, it reached 32 °C (89.6 °F) in May 2004.
Precipitation amounts to 210 mm (8.3 in), distributed over 18 days.
The day lasts on average 13 hours and 25 minutes.
There are on average 5 hours of sunshine per day. So, the sun shines 36% of the time.
The average humidity is 81%. Hence, the air is normally humid.
The average wind speed is 15 kph (9 mph).
The average sea temperature is of 26 °C (79 °F). Therefore, the sea is warm enough for swimming.
June is generally a very hot, muggy month. The average temperature is of 27.9 °C (82 °F), with a minimum of 25.5 °C (77.8 °F) and a maximum of 30.3 °C (86.5 °F).
On the coldest nights, the temperature usually drops to around 22 °C (72 °F). However, it dropped to 18.9 °C (66 °F) in June 2006.
On the warmest days, the temperature usually reaches around 32.5 °C (90.5 °F). However, it reached 34 °C (93.2 °F) in June 2015.
Precipitation amounts to 185 mm (7.3 in), distributed over 18 days.
The day lasts on average 13 hours and 40 minutes. June 21, the summer solstice, is the longest day of the year in the Northern Hemisphere.
There are on average 6.5 hours of sunshine per day. So, the sun shines 47% of the time.
The average humidity is 84%. Hence, the air is normally humid.
The average wind speed is 16 kph (10 mph).
The average sea temperature is of 28 °C (82.5 °F). Therefore, the sea is pleasantly warm and allows long swims.
July, the hottest month of the year, is generally a very hot, muggy month. The average temperature is of 29.1 °C (84 °F), with a minimum of 26.4 °C (79.6 °F) and a maximum of 31.8 °C (89.2 °F).
On the coldest nights of the month, the temperature usually drops to around 24 °C (75.5 °F). However, it dropped to 20 °C (68 °F) in July 1993.
On the warmest days of the month, the temperature usually reaches around 33.5 °C (92 °F). However, it reached 35 °C (95 °F) in July 2016.
Precipitation amounts to 130 mm (5.1 in), distributed over 17 days.
The day lasts on average 13 hours and 30 minutes.
There are on average 8 hours of sunshine per day. So, the sun shines 59% of the time.
The average humidity is 79%. Hence, the air is normally humid.
The average wind speed is 16 kph (10 mph).
The average sea temperature is of 29 °C (84 °F). Therefore, the sea is pleasantly warm and allows long swims.
August is generally a very hot, muggy month. The average temperature is of 28.8 °C (84 °F), with a minimum of 26.1 °C (79 °F) and a maximum of 31.4 °C (88.5 °F).
On the coldest nights of the month, the temperature usually drops to around 24 °C (75.5 °F). However, it dropped to 23 °C (73.4 °F) in August 2002.
On the warmest days of the month, the temperature usually reaches around 33 °C (91.5 °F). However, it reached 35 °C (95 °F) in August 2013.
Precipitation amounts to 265 mm (10.4 in), distributed over 19 days.
The day lasts on average 13 hours and 0 minutes.
There are on average 7 hours of sunshine per day. So, the sun shines 55% of the time.
The average humidity is 81%. Hence, the air is normally humid.
The average wind speed is 16 kph (10 mph).
The average sea temperature is of 29 °C (84 °F). Therefore, the sea is pleasantly warm and allows long swims.
September is generally a very hot, muggy month. The average temperature is of 27.7 °C (82 °F), with a minimum of 25.2 °C (77.3 °F) and a maximum of 30.2 °C (86.3 °F).
On the coldest nights, the temperature usually drops to around 22.5 °C (73 °F). However, it dropped to 19.8 °C (67.6 °F) in September 1997.
On the warmest days, the temperature usually reaches around 32 °C (90 °F). However, it reached 34 °C (93.2 °F) in September 2017.
Precipitation amounts to 230 mm (9.1 in), distributed over 17 days.
The day lasts on average 12 hours and 20 minutes.
There are on average 6 hours of sunshine per day. So, the sun shines 50% of the time.
The average humidity is 78%. Hence, the air is normally humid.
The average wind speed is 17 kph (10 mph).
The average sea temperature is of 29 °C (84 °F). Therefore, the sea is pleasantly warm and allows long swims.
October is generally a warm to hot, muggy month. The average temperature is of 25.6 °C (78 °F), with a minimum of 23.4 °C (74 °F) and a maximum of 27.8 °C (82.1 °F).
On the coldest nights, which normally occur at the end of the month, the temperature usually drops to around 20.5 °C (68.5 °F). However, it dropped to 18 °C (64.4 °F) in October 2003.
On the warmest days, which normally occur at the beginning of the month, the temperature usually reaches around 30.5 °C (86.5 °F). However, it reached 32.4 °C (90.3 °F) in October 2009.
Precipitation amounts to 155 mm (6.1 in), distributed over 17 days.
The day lasts on average 11 hours and 30 minutes.
There are on average 5 hours of sunshine per day. So, the sun shines 43% of the time.
The average humidity is 75%. Hence, the air is normally humid.
The average wind speed is 19 kph (12 mph).
The average sea temperature is of 28 °C (82.5 °F). Therefore, the sea is pleasantly warm and allows long swims.
November is generally a warm to hot, muggy month. The average temperature is of 23.1 °C (74 °F), with a minimum of 20.9 °C (69.5 °F) and a maximum of 25.3 °C (77.5 °F).
On the coldest nights, which normally occur at the end of the month, the temperature usually drops to around 17.5 °C (63.5 °F). However, it dropped to 13 °C (55.4 °F) in November 2013.
On the warmest days, which normally occur at the beginning of the month, the temperature usually reaches around 28.5 °C (83.5 °F). However, it reached 30.3 °C (86.5 °F) in November 2008.
Precipitation amounts to 145 mm (5.7 in), distributed over 18 days.
The day lasts on average 10 hours and 55 minutes.
There are on average 3.5 hours of sunshine per day. So, the sun shines 34% of the time.
The average humidity is 73%. Hence, the air is normally humid.
The average wind speed is 19 kph (12 mph).
The average sea temperature is of 26 °C (79 °F). Therefore, the sea is warm enough for swimming.
December is generally a warm month. The average temperature is of 19.9 °C (68 °F), with a minimum of 17.7 °C (63.9 °F) and a maximum of 22.1 °C (71.9 °F).
On the coldest nights of the month, the temperature usually drops to around 13.5 °C (56.5 °F). However, it dropped to 10 °C (50 °F) in December 2010.
On the warmest days of the month, the temperature usually reaches around 26.5 °C (79.5 °F). However, it reached 29 °C (84.2 °F) in December 2018.
Precipitation amounts to 130 mm (5.1 in), distributed over 19 days.
The day lasts on average 10 hours and 35 minutes. December 21, the winter solstice, is the shortest day of the year in the Northern Hemisphere.
There are on average 3.5 hours of sunshine per day. So, the sun shines 31% of the time.
The average humidity is 71%. Hence, the air is normally humid.
The average wind speed is 19 kph (12 mph).
The average sea temperature is of 25 °C (77 °F). Therefore, the sea is warm enough for swimming.