![]() Climate chart - Hiroshima (Japan)
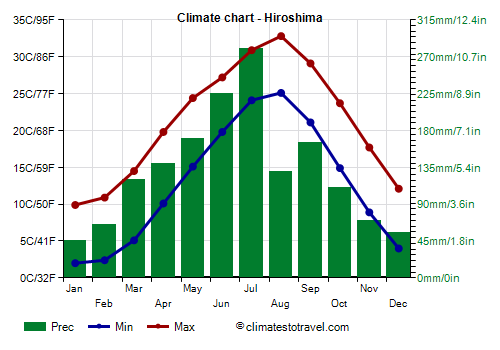
Climate chart - Hiroshima (Japan)
The climate of Hiroshima, a Japanese city in the southwestern part of Honshu Island, is
temperate humid, with quite mild winters and muggy, rainy summers. Like the rest of Japan, the city is affected by the
monsoon circulation: in winter, the northwest cold currents prevail, while in summer, they are replaced by hot and humid currents of tropical origin.
The town is located on the coast, in the Seto Inland Sea, a short distance from Shikoku and Kyushu islands.
In
winter, there are fairly mild periods, with highs above 10 °C (50 °F), alternating with cold periods, with wind and rain, highs around 5/7 °C (41/45 °F) or less, and possible falls of sleet or snow. Snowfalls, however, are generally light, as are nocturnal frosts.
Summers are hot and humid; there can be periods of good weather, with maximum temperatures around 35 °C (95 °F), tropical nights and high humidity, but also periods of bad weather due to the summer monsoon. August is the hottest month, both because of the thermal inertia of the sea and because of the lower frequency of periods of bad weather. Here are the average temperatures.
Hiroshima - Average temperatures (1991-2020) | Month | Min (°C) | Max (°C) | Mean (°C) | Min (°F) | Max (°F) | Mean (°F) |
|---|
| January | 2 | 9.9 | 6 | 36 | 50 | 42.7 |
|---|
| February | 2.4 | 10.9 | 6.6 | 36 | 52 | 44 |
|---|
| March | 5.1 | 14.5 | 9.8 | 41 | 58 | 49.6 |
|---|
| April | 10.1 | 19.8 | 15 | 50 | 68 | 58.9 |
|---|
| May | 15.1 | 24.4 | 19.8 | 59 | 76 | 67.6 |
|---|
| June | 19.8 | 27.2 | 23.5 | 68 | 81 | 74.3 |
|---|
| July | 24.1 | 30.9 | 27.5 | 75 | 88 | 81.5 |
|---|
| August | 25.1 | 32.8 | 29 | 77 | 91 | 84.1 |
|---|
| September | 21.1 | 29.1 | 25.1 | 70 | 84 | 77.2 |
|---|
| October | 14.9 | 23.7 | 19.3 | 59 | 75 | 66.7 |
|---|
| November | 8.9 | 17.7 | 13.3 | 48 | 64 | 55.9 |
|---|
| December | 4 | 12.1 | 8 | 39 | 54 | 46.5 |
|---|
| Year | 12.8 | 21.1 | 16.9 | 55 | 70.1 | 62.5 |
|---|
It should be noted that the temperatures recorded at the airport, which is located in a green zone, about 40 kilometers (25 miles) east of the city, and 330 meters (1,080 feet) above sea level, are much lower than those recorded in the city: for example, in January 2016, the temperature dropped to -8 °C (18 °F) at the airport and to -4 °C (25 °F) in the city.
Rainfall is abundant, in fact, it amounts to 1,570 millimeters (62 inches) per year. Winter is undoubtedly the driest season. The rainiest months are June and July, ie the first period of the rainy season (called
Baiu). In August, there is a certain decrease in rain frequency: on average, among the summer months, it is the hottest as well as the driest and sunniest. Here is the average precipitation.
Hiroshima - Average precipitation| Month | Millimeters | Inches | Days |
|---|
| January | 45 | 1.8 | 7 |
|---|
| February | 65 | 2.6 | 8 |
|---|
| March | 120 | 4.7 | 11 |
|---|
| April | 140 | 5.5 | 10 |
|---|
| May | 170 | 6.7 | 10 |
|---|
| June | 225 | 8.9 | 12 |
|---|
| July | 280 | 11 | 12 |
|---|
| August | 130 | 5.1 | 9 |
|---|
| September | 165 | 6.5 | 10 |
|---|
| October | 110 | 4.3 | 7 |
|---|
| November | 70 | 2.8 | 7 |
|---|
| December | 55 | 2.2 | 8 |
|---|
| Year | 1570 | 61.8 | 109 |
|---|
The amount of
sunshine in Hiroshima is not very good, however, there are two relative maxima, one in spring (April-May) and the other in August, after the Baiu rains, both with 6.5/7 hours of sunshine per day. Here are the average sunshine hours per day.
Hiroshima - Sunshine hours| Month | Average | Total |
|---|
January | 4.5 | 140 | February | 5 | 140 | March | 5.5 | 175 | April | 6.5 | 190 | May | 7 | 210 | June | 5 | 155 | July | 5.5 | 175 | August | 6.5 | 205 | September | 5.5 | 165 | October | 6 | 180 | November | 5 | 155 | December | 4.5 | 140 | Year | 5.6 | 2035 |

The
sea in Hiroshima is warm enough for swimming, with a temperature of 23 °C (73 °F) or more, from July to October, and it becomes pleasantly warm in August.
Hiroshima - Sea temperature| Month | Celsius (°C) | Fahrenheit (°F) |
|---|
January | 16 | 61 | February | 15 | 59 | March | 15 | 59 | April | 16 | 61 | May | 18.5 | 65 | June | 21.5 | 71 | July | 25 | 77 | August | 27 | 81 | September | 26 | 79 | October | 23.5 | 74 | November | 21 | 70 | December | 18.5 | 65 | Year | 20.2 | 68.3 |
From June to October (but especially from August to early October), Hiroshima can be affected by
typhoons, the tropical cyclones of Southeast Asia, though this area, in the Seto Inland Sea, is relatively protected (however, in September 1945, the city was hit by a typhoon that caused a lot of damage).
Best Time
As regards to the climate, the best times to visit Hiroshima are spring and autumn, and in particular, from mid-April to mid-May and from late October to mid-November.
The
cherry blossoming in Hiroshima occurs around April 2-3: even though in some years it can get a little cold, with highs around 12 °C (54 °F), you can also take advantage of this period.
In summer, August is partly preferable to July, having more sunshine and less rainfall, but it is also true that it is hotter and there's a greater risk of typhoons.
Hiroshima - Weather by month
Based on the period 1991-2020
January, the coldest month of the year, is generally a quite cold month. The average temperature is of 6.0 °C (43 °F), with a minimum of 2 °C (35.6 °F) and a maximum of 9.9 °C (49.8 °F).

On the coldest nights of the month, the temperature usually drops to around -2 °C (28.5 °F). However, it dropped to -4.6 °C (23.7 °F) in January 2011.

On the warmest days of the month, the temperature usually reaches around 14.5 °C (58.5 °F). However, it reached 17.5 °C (63.5 °F) in January 1997.

Precipitation amounts to 45 mm (1.8 in), distributed over 7 days.
The day lasts on average 10 hours and 10 minutes.

There are on average 4.5 hours of sunshine per day. So, the sun shines 44% of the time.
The average humidity is 59%.
The average wind speed is 11 kph (7 mph).

The average sea temperature is of 16 °C (61 °F). Therefore, the sea is cold for swimming.
February is generally a quite mild month. The average temperature is of 6.6 °C (44 °F), with a minimum of 2.4 °C (36.3 °F) and a maximum of 10.9 °C (51.6 °F).
On the coldest nights of the month, the temperature usually drops to around -1.5 °C (29 °F). However, it dropped to -4.3 °C (24.3 °F) in February 2018.
On the warmest days of the month, the temperature usually reaches around 17 °C (62.5 °F). However, it reached 21.5 °C (70.7 °F) in February 2009.
Precipitation amounts to 65 mm (2.6 in), distributed over 8 days.
The day lasts on average 11 hours and 0 minutes.
There are on average 5 hours of sunshine per day. So, the sun shines 45% of the time.
The average humidity is 58%.
The average wind speed is 11 kph (7 mph).
The average sea temperature is of 15 °C (59 °F). Therefore, the sea is cold for swimming.
March is generally a mild month. The average temperature is of 9.8 °C (50 °F), with a minimum of 5.1 °C (41.2 °F) and a maximum of 14.5 °C (58.1 °F).
On the coldest nights, which normally occur at the beginning of the month, the temperature usually drops to around 0 °C (32 °F). However, it dropped to -1.8 °C (28.8 °F) in March 2001.
On the warmest days, which normally occur at the end of the month, the temperature usually reaches around 21 °C (69.5 °F). However, it reached 22.6 °C (72.7 °F) in March 2010.
Precipitation amounts to 120 mm (4.7 in), distributed over 11 days.
The day lasts on average 12 hours and 0 minutes.
There are on average 5.5 hours of sunshine per day. So, the sun shines 47% of the time.
The average humidity is 57%.
The average wind speed is 12 kph (7 mph).
The average sea temperature is of 15 °C (58.5 °F). Therefore, the sea is cold for swimming.
April is generally a very mild month. The average temperature is of 15.0 °C (59 °F), with a minimum of 10.1 °C (50.2 °F) and a maximum of 19.8 °C (67.6 °F).
On the coldest nights, which normally occur at the beginning of the month, the temperature usually drops to around 3.5 °C (38 °F). However, it dropped to 1 °C (33.8 °F) in April 1993.
On the warmest days, which normally occur at the end of the month, the temperature usually reaches around 25.5 °C (78.5 °F). However, it reached 29 °C (84.2 °F) in April 2004.
Precipitation amounts to 140 mm (5.5 in), distributed over 10 days.
The day lasts on average 13 hours and 5 minutes.
There are on average 6.5 hours of sunshine per day. So, the sun shines 49% of the time.
The average humidity is 58%.
The average wind speed is 12 kph (7 mph).
The average sea temperature is of 16 °C (60.5 °F). Therefore, the sea is cold for swimming.
May is generally a warm month. The average temperature is of 19.8 °C (68 °F), with a minimum of 15.1 °C (59.2 °F) and a maximum of 24.4 °C (75.9 °F).
On the coldest nights, which normally occur at the beginning of the month, the temperature usually drops to around 9.5 °C (49.5 °F). However, it dropped to 6 °C (42.8 °F) in May 1991.
On the warmest days, which normally occur at the end of the month, the temperature usually reaches around 29.5 °C (84.5 °F). However, it reached 31.5 °C (88.7 °F) in May 1998.
Precipitation amounts to 170 mm (6.7 in), distributed over 10 days.
The day lasts on average 14 hours and 0 minutes.
There are on average 7 hours of sunshine per day. So, the sun shines 49% of the time.
The average humidity is 62%.
The average wind speed is 11 kph (7 mph).
The average sea temperature is of 18.5 °C (65 °F). Therefore, the sea is very cool for swimming.
June is generally a warm to hot, muggy month. The average temperature is of 23.5 °C (74 °F), with a minimum of 19.8 °C (67.6 °F) and a maximum of 27.2 °C (81 °F).
On the coldest nights, which normally occur at the beginning of the month, the temperature usually drops to around 15.5 °C (59.5 °F). However, it dropped to 13 °C (55.4 °F) in June 2008.
On the warmest days, which normally occur at the end of the month, the temperature usually reaches around 31.5 °C (89 °F). However, it reached 33.6 °C (92.5 °F) in June 2011.
Precipitation amounts to 225 mm (8.9 in), distributed over 12 days.
The day lasts on average 14 hours and 25 minutes. So the days are long. June 21, the summer solstice, is the longest day of the year in the Northern Hemisphere.
There are on average 5 hours of sunshine per day. So, the sun shines 36% of the time.
The average humidity is 71%. Hence, the air is normally humid.
The average wind speed is 11 kph (7 mph).
The average sea temperature is of 21.5 °C (70.5 °F). Therefore, the sea is cool for swimming.
July is generally a warm to hot, muggy month. The average temperature is of 27.5 °C (82 °F), with a minimum of 24.1 °C (75.4 °F) and a maximum of 30.9 °C (87.6 °F).
On the coldest nights of the month, the temperature usually drops to around 20.5 °C (68.5 °F). However, it dropped to 16.9 °C (62.4 °F) in July 1992.
On the warmest days of the month, the temperature usually reaches around 35 °C (95.5 °F). However, it reached 38.7 °C (101.7 °F) in July 1994.
Precipitation amounts to 280 mm (11 in), distributed over 12 days.
The day lasts on average 14 hours and 10 minutes. So the days are long.
There are on average 5.5 hours of sunshine per day. So, the sun shines 39% of the time.
The average humidity is 73%. Hence, the air is normally humid.
The average wind speed is 12 kph (7 mph).
The average sea temperature is of 25 °C (76.5 °F). Therefore, the sea is warm enough for swimming.
August, the hottest month of the year, is generally a very hot month. The average temperature is of 29.0 °C (84 °F), with a minimum of 25.1 °C (77.2 °F) and a maximum of 32.8 °C (91 °F).
On the coldest nights of the month, the temperature usually drops to around 21 °C (70 °F). However, it dropped to 18.7 °C (65.7 °F) in August 2002.
On the warmest days of the month, the temperature usually reaches around 36 °C (97 °F). However, it reached 37.9 °C (100.2 °F) in August 2001.
Precipitation amounts to 130 mm (5.1 in), distributed over 9 days.
The day lasts on average 13 hours and 25 minutes.
There are on average 6.5 hours of sunshine per day. So, the sun shines 50% of the time.
The average humidity is 69%.
The average wind speed is 12 kph (8 mph).
The average sea temperature is of 27 °C (81 °F). Therefore, the sea is pleasantly warm and allows long swims.
September is generally a warm to hot month. The average temperature is of 25.1 °C (77 °F), with a minimum of 21.1 °C (70 °F) and a maximum of 29.1 °C (84.4 °F).
On the coldest nights, which normally occur at the end of the month, the temperature usually drops to around 16 °C (60.5 °F). However, it dropped to 12.8 °C (55 °F) in September 1992.
On the warmest days, which normally occur at the beginning of the month, the temperature usually reaches around 33.5 °C (92.5 °F). However, it reached 36.9 °C (98.4 °F) in September 2007.
Precipitation amounts to 165 mm (6.5 in), distributed over 10 days.
The day lasts on average 12 hours and 20 minutes.
There are on average 5.5 hours of sunshine per day. So, the sun shines 45% of the time.
The average humidity is 67%.
The average wind speed is 12 kph (8 mph).
The average sea temperature is of 26 °C (78.5 °F). Therefore, the sea is warm enough for swimming.
October is generally a warm month. The average temperature is of 19.3 °C (67 °F), with a minimum of 14.9 °C (58.8 °F) and a maximum of 23.7 °C (74.7 °F).
On the coldest nights, which normally occur at the end of the month, the temperature usually drops to around 9 °C (48 °F). However, it dropped to 6 °C (42.8 °F) in October 2002.
On the warmest days, which normally occur at the beginning of the month, the temperature usually reaches around 29 °C (84 °F). However, it reached 31.4 °C (88.5 °F) in October 2019.
Precipitation amounts to 110 mm (4.3 in), distributed over 7 days.
The day lasts on average 11 hours and 20 minutes.
There are on average 6 hours of sunshine per day. So, the sun shines 51% of the time.
The average humidity is 62%.
The average wind speed is 12 kph (7 mph).
The average sea temperature is of 23.5 °C (74 °F). Therefore, the sea can be considered barely acceptable for swimming.
November is generally a mild month. The average temperature is of 13.3 °C (56 °F), with a minimum of 8.9 °C (48 °F) and a maximum of 17.7 °C (63.9 °F).
On the coldest nights, which normally occur at the end of the month, the temperature usually drops to around 3.5 °C (38 °F). However, it dropped to 0.2 °C (32.4 °F) in November 2008.
On the warmest days, which normally occur at the beginning of the month, the temperature usually reaches around 23 °C (73 °F). However, it reached 25.6 °C (78.1 °F) in November 2020.
Precipitation amounts to 70 mm (2.8 in), distributed over 7 days.
The day lasts on average 10 hours and 25 minutes.
There are on average 5 hours of sunshine per day. So, the sun shines 49% of the time.
The average humidity is 61%.
The average wind speed is 11 kph (7 mph).
The average sea temperature is of 21 °C (69.5 °F). Therefore, the sea is cool for swimming.
December is generally a quite mild month. The average temperature is of 8.0 °C (46 °F), with a minimum of 4 °C (39.2 °F) and a maximum of 12.1 °C (53.8 °F).
On the coldest nights of the month, the temperature usually drops to around 0 °C (31.5 °F). However, it dropped to -3.6 °C (25.5 °F) in December 2005.
On the warmest days of the month, the temperature usually reaches around 17.5 °C (63.5 °F). However, it reached 20.9 °C (69.6 °F) in December 1994.
Precipitation amounts to 55 mm (2.2 in), distributed over 8 days.
The day lasts on average 9 hours and 55 minutes. December 21, the winter solstice, is the shortest day of the year in the Northern Hemisphere.
There are on average 4.5 hours of sunshine per day. So, the sun shines 46% of the time.
The average humidity is 61%.
The average wind speed is 10 kph (7 mph).
The average sea temperature is of 18.5 °C (65 °F). Therefore, the sea is very cool for swimming.