![]() Climate chart - Gyor (Hungary)
Climate chart - Gyor (Hungary)
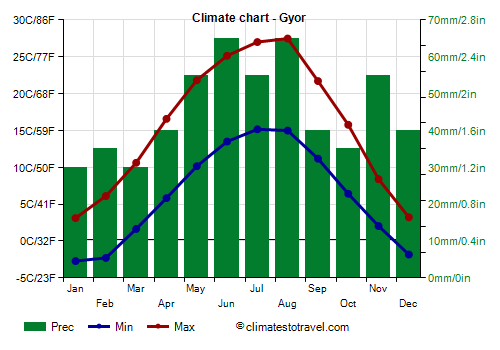
The climate of Gyor is
continental, with cold winters and warm summers.
The city is located in the north-west of Hungary, a short distance from the border with Slovakia, but also 110 km (70 mi) away from Vienna.
Winter is cold and gray. Snowfalls are quite frequent, but generally not abundant.
Sometimes there can be cold spells, in which temperatures can drop to -15 °C (5 °F) or even below. The coldest record is -23.8 °C (-10.8 °F) and was set in February 1963 and in January 1968.
In
summer, there are pleasant periods that lend themselves to outdoor activities, although sometimes there can be rains and thunderstorms.
However, there are also very hot and sultry periods, with highs that can reach and exceed 35 °C (95 °F). The highest record is 40.6 °C (105.1 °F) and was set in August 2013.

Best Time
In order to avoid both the winter cold and the summer heat, the
best times to visit Gyor are spring and autumn, and in particular, the months of May, June and September: daytime temperatures are pleasant, although it's better to bring a sweater and a jacket for the evening. In July and August, the temperature is usually not too hot, however, there is the risk of some very hot days, which can happen, though more rarely, also in the second half of June and in the first half of September.
Gyor - Climate data
The
average temperature of the coldest month (January) is of 0.2 °C (32.4 °F), that of the warmest month (August) is of 21.2 °C (70.2 °F). Here are the average temperatures.
Gyor - Average temperatures (1991-2000) | Month | Min (°C) | Max (°C) | Mean (°C) | Min (°F) | Max (°F) | Mean (°F) |
|---|
| January | -2.7 | 3.1 | 0.2 | 27 | 38 | 32.4 |
|---|
| February | -2.3 | 6.1 | 1.9 | 28 | 43 | 35.4 |
|---|
| March | 1.6 | 10.6 | 6.1 | 35 | 51 | 43 |
|---|
| April | 5.8 | 16.6 | 11.2 | 42 | 62 | 52.2 |
|---|
| May | 10.2 | 21.8 | 16 | 50 | 71 | 60.8 |
|---|
| June | 13.5 | 25.1 | 19.3 | 56 | 77 | 66.8 |
|---|
| July | 15.2 | 27 | 21.1 | 59 | 81 | 69.9 |
|---|
| August | 15 | 27.5 | 21.2 | 59 | 81 | 70.2 |
|---|
| September | 11.2 | 21.7 | 16.4 | 52 | 71 | 61.6 |
|---|
| October | 6.4 | 15.8 | 11.1 | 44 | 60 | 52 |
|---|
| November | 2 | 8.4 | 5.2 | 36 | 47 | 41.4 |
|---|
| December | -1.8 | 3.2 | 0.7 | 29 | 38 | 33.3 |
|---|
| Year | 6.2 | 15.6 | 10.9 | 43.2 | 60.1 | 51.5 |
|---|
amounts to 530 millimeters (20.9 inches) per year: so, it is at an intermediate level. It ranges from 30 mm (1.2 in) in the driest months (January, March) to 65 mm (2.6 in) in the wettest ones (June, August) Here is the average precipitation.
Gyor - Average precipitation| Month | Millimeters | Inches | Days |
|---|
| January | 30 | 1.2 | 7 |
|---|
| February | 35 | 1.4 | 6 |
|---|
| March | 30 | 1.2 | 7 |
|---|
| April | 40 | 1.6 | 7 |
|---|
| May | 55 | 2.2 | 8 |
|---|
| June | 65 | 2.6 | 9 |
|---|
| July | 55 | 2.2 | 7 |
|---|
| August | 65 | 2.6 | 7 |
|---|
| September | 40 | 1.6 | 6 |
|---|
| October | 35 | 1.4 | 5 |
|---|
| November | 55 | 2.2 | 8 |
|---|
| December | 40 | 1.6 | 7 |
|---|
| Year | 530 | 20.9 | 84 |
|---|
There are on average around 1965
sunshine hours per year. Here are the average hours of sunshine per day.
Gyor - Sunshine hours| Month | Average | Total |
|---|
January | 2 | 60 | February | 3.5 | 100 | March | 4.5 | 140 | April | 6.5 | 190 | May | 8 | 245 | June | 8.5 | 250 | July | 8.5 | 270 | August | 8.5 | 260 | September | 6.5 | 190 | October | 4.5 | 145 | November | 2.5 | 75 | December | 1.5 | 50 | Year | 5.4 | 1965 |