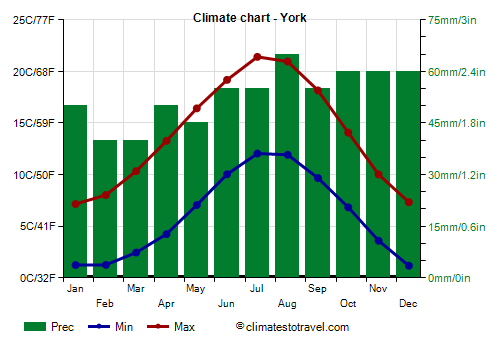
Select units of measurement for the temperature and rainfall tables (metric or imperial).
Average weather, temperature, rainfall, sunshine hours

The climate of York is
oceanic, with quite cold, rainy winters and mild, relatively rainy summers.
The city is located in north-central England, in North Yorkshire, 55 km (35 mi) away from the east coast.
Precipitation is frequent but not abundant because we are to the east of the Pennines, the low mountains that run through England from north to south like a backbone and partially block the wet currents from the Irish Sea.
Winter is not very cold, but the sky is often cloudy, the humidity is high and there are periods when the wind blows moderate or strong. The rains are frequent.
On the coldest nights of the year, the temperature generally drops to around -6/-7 °C (19/21 °F), but can sometimes drop to lower values. At the RAF station of Linton-on-Ouse, the temperature reached -17 °C (1.5 °F) in December 2010, and to -10.5 °C (13 °F) in February 2012 and in February 2018.
In
summer, temperatures are generally mild or cool. It can also rain, and there is not much difference from winter either.
However, hot periods cannot be ruled out, usually of short duration. The temperature reached 31 °C (88 °F) in August 2003, in July 2006 and in July 2015, and as high as 35 °C (95 °F) in July 2019 and 38 °C (100.5 °F) in July 2022.

Best Time
The best time to visit York is the summer, or more generally
from mid-May to mid-September: temperatures are generally good for outdoors activities, although it's better to bring an umbrella, and a sweatshirt or sweater for the evening or for cool days.
York - Climate data
In York, the
average temperature of the coldest month (January) is of
4.2 °C, that of the warmest month (July) is of
16.7 °C. Here are the average temperatures.
York - Average temperatures (1991-2020) |
| Month | Min | Max | Mean |
|---|
| January | 1.2 | 7.2 | 4.2 |
|---|
| February | 1.3 | 8 | 4.6 |
|---|
| March | 2.5 | 10.4 | 6.4 |
|---|
| April | 4.2 | 13.3 | 8.8 |
|---|
| May | 7.1 | 16.4 | 11.8 |
|---|
| June | 10 | 19.2 | 14.6 |
|---|
| July | 12 | 21.4 | 16.7 |
|---|
| August | 11.9 | 21 | 16.5 |
|---|
| September | 9.7 | 18.2 | 13.9 |
|---|
| October | 6.8 | 14.1 | 10.5 |
|---|
| November | 3.6 | 10 | 6.8 |
|---|
| December | 1.2 | 7.3 | 4.3 |
|---|
| Year | 6 | 13.9 | 9.95 |
|---|
amounts to
635 millimeters per year: so, it is at an intermediate level. It ranges from
40 millimeters in the driest months (February, March) to
65 millimeters in the wettest one (August). Here is the average precipitation.
York - Average precipitation| Month | Days |
|---|
| January | 50 | 11 |
|---|
| February | 40 | 10 |
|---|
| March | 40 | 9 |
|---|
| April | 50 | 9 |
|---|
| May | 45 | 9 |
|---|
| June | 55 | 10 |
|---|
| July | 55 | 9 |
|---|
| August | 65 | 10 |
|---|
| September | 55 | 9 |
|---|
| October | 60 | 11 |
|---|
| November | 60 | 12 |
|---|
| December | 60 | 12 |
|---|
| Year | 635 | 120 |
|---|
There are on average around 1550
sunshine hours per year. Here are the average hours of sunshine per day.
York - Sunshine hours| Month | Average | Total |
|---|
| January | 1.5 | 40 |
|---|
| February | 2 | 60 |
|---|
| March | 3 | 100 |
|---|
| April | 4.5 | 140 |
|---|
| May | 6 | 190 |
|---|
| June | 7.5 | 220 |
|---|
| July | 7.5 | 230 |
|---|
| August | 6.5 | 205 |
|---|
| September | 5 | 155 |
|---|
| October | 3.5 | 105 |
|---|
| November | 2 | 65 |
|---|
| December | 1.5 | 45 |
|---|
| Year | 4.2 | 1550 |
|---|