Select units of measurement for the temperature and rainfall tables (metric or imperial).
Average weather, temperature, rainfall, sunshine hours

The climate of Sunderland is
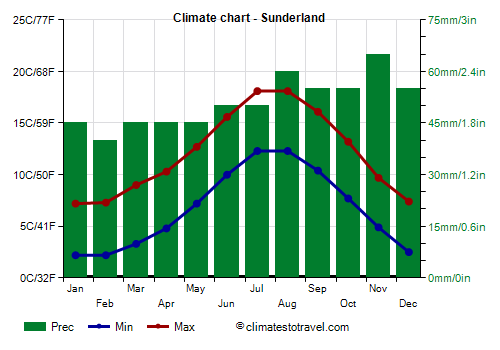
oceanic, with quite cold, rainy winters and mild, relatively rainy summers.
The city is located in north-eastern England, on the coast, at the mouth of the River Wear, in Tyne and Wear county.
Winter is not very cold, but the sky is often cloudy, the humidity is high and there are periods when the wind blows moderate or strong. The rains are quite frequent.
When cold currents blow from the northeast, it can even snow.
On the coldest nights of the year, the temperature generally drops to around -5 °C (23 °F), but can sometimes drop to lower values. In the nearby town of Tynemouth, the temperature reached -9 °C (16 °F) in December 1981, to -9.5 °C (15 °F) in January 1982, to -7 °C (19.5 °F) in February 1986, and to -6 °C (21 °F) in December 1995 (when Newcastle broke the cold record with -14 °C or 7 °F).
In
summer, temperatures are generally mild or cool. It can also rain, and there is not much difference from winter either.
Due to its position enough to the north and on the east coast, summer is cool, so much so that the highs in July and August only reach 18 °C (64.5 °F). Even the brief heatwaves that can sometimes affect central and southern England, generally do not arrive here. On the warmest days of the year, the temperature typically reaches 25/26 °C (77/79 °F), and more rarely to higher values (for example, in August 1990, it reached 32 °C or 89.5 °F in Tynemouth).
In June, it can still be quite cold, with highs of 10/12 °C (50/54 °F). In summer, fog can form at night and in the early morning, and highs can sometimes remain around 14/15 °C (57/59 °F) even in July and August.
The
average temperature of the coldest month (January) is of 4.7 °C (40 °F), that of the warmest months (July, August) is of 15.2 °C (59 °F). Here are the average temperatures.
Sunderland - Average temperatures (1981-2010) |
| Month | Min | Max | Mean |
|---|
| January | 2.2 | 7.2 | 4.7 |
|---|
| February | 2.2 | 7.3 | 4.8 |
|---|
| March | 3.3 | 9 | 6.2 |
|---|
| April | 4.8 | 10.3 | 7.6 |
|---|
| May | 7.2 | 12.7 | 10 |
|---|
| June | 10 | 15.6 | 12.8 |
|---|
| July | 12.3 | 18.1 | 15.2 |
|---|
| August | 12.3 | 18.1 | 15.2 |
|---|
| September | 10.4 | 16.1 | 13.2 |
|---|
| October | 7.7 | 13.2 | 10.4 |
|---|
| November | 4.9 | 9.7 | 7.3 |
|---|
| December | 2.5 | 7.4 | 5 |
|---|
| Year | 6.7 | 12.1 | 9.35 |
|---|
amounts to 595 millimeters (23.4 inches) per year. At least as regards to the quantity, it is at the lowest levels in Great Britain because the Pennines to the southwest, which in this sector reach the greatest heights (893 meters or 2,929 feet in Cross Fell), partially block the wet currents from the Irish Sea. It ranges from 40 mm (1.6 in) in the driest month (February) to 65 mm (2.6 in) in the wettest (November). Here is the average precipitation.
Sunderland - Average precipitation| Month | Days |
|---|
| January | 45 | 10 |
|---|
| February | 40 | 8 |
|---|
| March | 45 | 9 |
|---|
| April | 45 | 8 |
|---|
| May | 45 | 8 |
|---|
| June | 50 | 9 |
|---|
| July | 50 | 9 |
|---|
| August | 60 | 9 |
|---|
| September | 55 | 8 |
|---|
| October | 55 | 11 |
|---|
| November | 65 | 12 |
|---|
| December | 55 | 10 |
|---|
| Year | 595 | 110 |
|---|
On average, there are around 1,520
sunshine hours per year. Here are the average sunshine hours per day.
Sunderland - Sunshine hours| Month | Average | Total |
|---|
| January | 2 | 60 |
|---|
| February | 3 | 80 |
|---|
| March | 4 | 120 |
|---|
| April | 5 | 150 |
|---|
| May | 6 | 190 |
|---|
| June | 6 | 185 |
|---|
| July | 6 | 185 |
|---|
| August | 5.5 | 175 |
|---|
| September | 4.5 | 140 |
|---|
| October | 3.5 | 105 |
|---|
| November | 2.5 | 70 |
|---|
| December | 1.5 | 50 |
|---|
| Year | 4.2 | 1515 |
|---|
The
sea temperature ranges between 6 °C (43 °F) and 15 °C (59 °F). So, it never becomes warm for swimming. Here are the average sea temperatures.
Sunderland - Sea temperature| Month |
|---|
| January | 7 |
|---|
| February | 6.5 |
|---|
| March | 6.5 |
|---|
| April | 7 |
|---|
| May | 9 |
|---|
| June | 12 |
|---|
| July | 14 |
|---|
| August | 15.5 |
|---|
| September | 14 |
|---|
| October | 12 |
|---|
| November | 10"> |
|---|
| December | 8.5 |
|---|
| Year | 10.2 |
|---|

Best Time
The best time to visit Sunderland is the summer,
from June to August, since it is the mildest of the year. The temperatures are generally good for outdoors activities, although it's better to bring an umbrella, a jacket and a sweatshirt or sweater for the evening or for cool days.