Select units of measurement for the temperature and rainfall tables (metric or imperial).
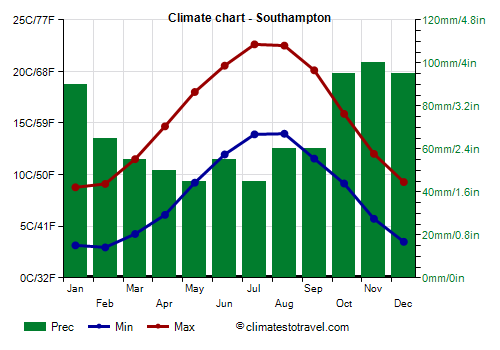
Average weather, temperature, rainfall, sunshine hours

The climate of Southampton is
oceanic, with quite cold, rainy winters and mild, relatively rainy summers.
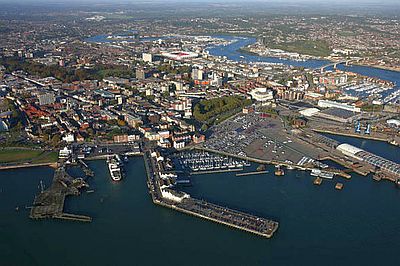
The city is located in the south of England, in the county of Hampshire, and overlooks the so-called
Southampton Water, an estuary into which sea waters penetrate, and which then opens into a stretch of sea called
The Solent, beyond which we find the Isle of Wight.
To the west of the city, we find instead the New Forest National Park.
Winter is not very cold, but the sky is often cloudy, the humidity is high and there are periods when the wind blows moderate or strong. The rains are frequent.
Snow is rare, but can occasionally occur. On the coldest nights of the year, the temperature generally drops to around -5 °C (23 °F), but can sometimes drop to lower values. The temperature dropped to -10 °C (14 °F) in January 1987.
In
summer, temperatures are generally mild or cool. It can also rain, albeit a little less often than in winter.
However, hot periods cannot be ruled out, usually of short duration. The temperature reached 35 °C (95 °F) in June 1976 and in August 1990.

Best Time
The
best time to visit Southampton is the summer, from June to August, since it is the warmest of the year, although even in this season, it's better to bring a sweatshirt, a light jacket and an umbrella. The month of June is a bit cooler, so you may prefer July and August. September is a good month as well: it's a bit rainier than the summer months, but the temperatures are still pleasant, especially in the first part.
As previously mentioned, the
sea is very cool even in summer, however, on sunny days, when the breeze is not too cool, you can sunbathe.
Southampton - Climate data
In Southampton, the
average temperature of the coldest month (January) is of
6 °C, that of the warmest month (July) is of
18.3 °C. Here are the average temperatures.
Southampton - Average temperatures (1991-2020) |
| Month | Min | Max | Mean |
|---|
| January | 3.2 | 8.8 | 6 |
|---|
| February | 3 | 9.1 | 6 |
|---|
| March | 4.3 | 11.5 | 7.9 |
|---|
| April | 6.1 | 14.7 | 10.4 |
|---|
| May | 9.2 | 18 | 13.6 |
|---|
| June | 12 | 20.6 | 16.3 |
|---|
| July | 13.9 | 22.6 | 18.3 |
|---|
| August | 14 | 22.5 | 18.2 |
|---|
| September | 11.6 | 20.1 | 15.8 |
|---|
| October | 9.2 | 15.9 | 12.5 |
|---|
| November | 5.7 | 12 | 8.9 |
|---|
| December | 3.5 | 9.3 | 6.4 |
|---|
| Year | 8 | 15.5 | 11.7 |
|---|
amounts to
820 millimeters per year: so, it is at an intermediate level. It ranges from
45 millimeters in the driest months (May, July) to
100 millimeters in the wettest one (November). Here is the average precipitation.
Southampton - Average precipitation| Month | Days |
|---|
| January | 90 | 12 |
|---|
| February | 65 | 10 |
|---|
| March | 55 | 10 |
|---|
| April | 50 | 9 |
|---|
| May | 45 | 8 |
|---|
| June | 55 | 8 |
|---|
| July | 45 | 8 |
|---|
| August | 60 | 8 |
|---|
| September | 60 | 9 |
|---|
| October | 95 | 12 |
|---|
| November | 100 | 13 |
|---|
| December | 95 | 13 |
|---|
| Year | 820 | 120 |
|---|
The
sea temperature ranges from
8.5 °C in February, March to
17 °C in August, September. Here are the average sea temperatures.
Southampton - Sea temperature| Month |
|---|
| January | 9.5 |
|---|
| February | 8.5 |
|---|
| March | 8.5 |
|---|
| April | 9.5 |
|---|
| May | 11 |
|---|
| June | 13.5 |
|---|
| July | 15.5 |
|---|
| August | 17 |
|---|
| September | 17 |
|---|
| October | 15.5 |
|---|
| November | 13.5"> |
|---|
| December | 11.5 |
|---|
| Year | 12.6 |
|---|
There are on average around 1705
sunshine hours per year. Here are the average hours of sunshine per day.
Southampton - Sunshine hours| Month | Average | Total |
|---|
| January | 2 | 65 |
|---|
| February | 3 | 85 |
|---|
| March | 4 | 125 |
|---|
| April | 6 | 180 |
|---|
| May | 7 | 215 |
|---|
| June | 7 | 210 |
|---|
| July | 7 | 225 |
|---|
| August | 6.5 | 205 |
|---|
| September | 5 | 150 |
|---|
| October | 3.5 | 115 |
|---|
| November | 2.5 | 75 |
|---|
| December | 2 | 55 |
|---|
| Year | 4.7 | 1705 |
|---|