![]() Climate chart - Blackburn (England)
Climate chart - Blackburn (England)
The climate of Blackburn is
oceanic, with quite cold winters and mild summers, and with frequent rains all year round.
The city is located in the north-west of England, in Lancashire.
The proximity of the East Lancashire hills makes the climate wetter than other low-lying areas of England.
Winter is not very cold, but the sky is often cloudy, the humidity is high and there are periods when the wind blows moderate or strong. The rains are frequent.
On the coldest nights of the year, the temperature generally drops to around -6/-7 °C (19/21 °F), but can sometimes drop to lower values.
Summer, from June to August, is mild, wet and cloudy, with quite frequent rains.
However, hot periods cannot be ruled out, usually of short duration.

Best Time
The best time to visit Blackburn is the summer, or more generally
from mid-May to mid-September: temperatures are generally good for outdoors activities, although it's better to bring an umbrella, and a sweatshirt or sweater for the evening or for cool days.
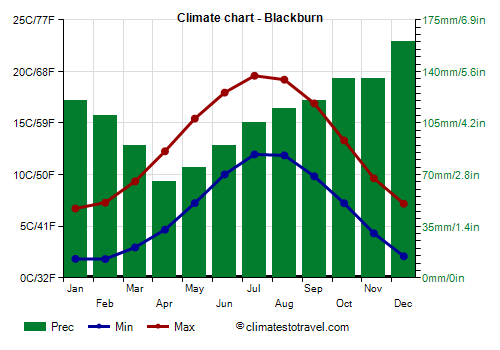
Blackburn - Climate data
The
average temperature of the coldest month (January) is of 4.3 °C (39.7 °F), that of the warmest month (July) is of 15.8 °C (60.4 °F). Here are the average temperatures.
Blackburn - Average temperatures (1991-2020) | Month | Min (°C) | Max (°C) | Mean (°C) | Min (°F) | Max (°F) | Mean (°F) |
|---|
| January | 1.8 | 6.7 | 4.3 | 35 | 44 | 39.7 |
|---|
| February | 1.8 | 7.3 | 4.6 | 35 | 45 | 40.2 |
|---|
| March | 3 | 9.4 | 6.2 | 37 | 49 | 43.1 |
|---|
| April | 4.7 | 12.3 | 8.5 | 40 | 54 | 47.3 |
|---|
| May | 7.2 | 15.4 | 11.3 | 45 | 60 | 52.4 |
|---|
| June | 10 | 18 | 14 | 50 | 64 | 57.2 |
|---|
| July | 12 | 19.6 | 15.8 | 54 | 67 | 60.4 |
|---|
| August | 11.9 | 19.2 | 15.5 | 53 | 67 | 60 |
|---|
| September | 9.8 | 16.9 | 13.4 | 50 | 62 | 56.1 |
|---|
| October | 7.2 | 13.3 | 10.3 | 45 | 56 | 50.5 |
|---|
| November | 4.3 | 9.6 | 7 | 40 | 49 | 44.6 |
|---|
| December | 2.1 | 7.2 | 4.6 | 36 | 45 | 40.4 |
|---|
| Year | 6.4 | 12.9 | 9.65 | 43.4 | 55.3 | 49.5 |
|---|
amounts to 1315 millimeters (51.8 inches) per year: it is therefore quite abundant. It ranges from 65 mm (2.6 in) in the driest month (April) to 160 mm (6.3 in) in the wettest one (December). Here is the average precipitation.
Blackburn - Average precipitation| Month | Millimeters | Inches | Days |
|---|
| January | 120 | 4.7 | 17 |
|---|
| February | 110 | 4.3 | 14 |
|---|
| March | 90 | 3.5 | 14 |
|---|
| April | 65 | 2.6 | 12 |
|---|
| May | 75 | 3 | 12 |
|---|
| June | 90 | 3.5 | 13 |
|---|
| July | 105 | 4.1 | 14 |
|---|
| August | 115 | 4.5 | 15 |
|---|
| September | 120 | 4.7 | 14 |
|---|
| October | 135 | 5.3 | 16 |
|---|
| November | 135 | 5.3 | 18 |
|---|
| December | 160 | 6.3 | 18 |
|---|
| Year | 1315 | 51.8 | 175 |
|---|
There are on average around 1380
sunshine hours per year. Here are the average hours of sunshine per day.
Blackburn - Sunshine hours| Month | Average | Total |
|---|
January | 1.5 | 50 | February | 2.5 | 70 | March | 3.5 | 105 | April | 5.5 | 160 | May | 6 | 185 | June | 6 | 175 | July | 5 | 155 | August | 5.5 | 165 | September | 4 | 120 | October | 3 | 95 | November | 2 | 65 | December | 1.5 | 40 | Year | 3.8 | 1380 |