![]() Climate chart - Moundou (Chad)
Climate chart - Moundou (Chad)
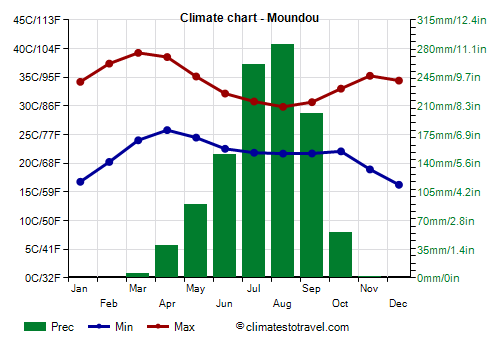
The climate of Moundou, the second largest city in Chad, is
tropical, with a dry season from November to March and a rainy season from May to October. The hottest period is from February to April, before the rains.
The city is located in the southwest of Chad, at an altitude of 400 meters (1,300 feet), not far from the border with Cameroon and the Central African Republic.
Moundou - Climate data
The
average temperature of the coldest month (December) is of 25.3 °C (77.6 °F), that of the warmest month (April) is of 32.2 °C (89.9 °F). Here are the average temperatures.
Moundou - Average temperatures (1991-2020) | Month | Min (°C) | Max (°C) | Mean (°C) | Min (°F) | Max (°F) | Mean (°F) |
|---|
| January | 16.8 | 34.2 | 25.5 | 62 | 94 | 77.9 |
|---|
| February | 20.2 | 37.4 | 28.8 | 68 | 99 | 83.8 |
|---|
| March | 24 | 39.3 | 31.6 | 75 | 103 | 88.9 |
|---|
| April | 25.8 | 38.5 | 32.2 | 78 | 101 | 89.9 |
|---|
| May | 24.5 | 35.1 | 29.8 | 76 | 95 | 85.6 |
|---|
| June | 22.5 | 32.2 | 27.3 | 73 | 90 | 81.2 |
|---|
| July | 21.8 | 30.8 | 26.3 | 71 | 87 | 79.3 |
|---|
| August | 21.7 | 29.8 | 25.8 | 71 | 86 | 78.4 |
|---|
| September | 21.7 | 30.7 | 26.2 | 71 | 87 | 79.1 |
|---|
| October | 22.1 | 33 | 27.5 | 72 | 91 | 81.6 |
|---|
| November | 18.9 | 35.2 | 27.1 | 66 | 95 | 80.8 |
|---|
| December | 16.2 | 34.4 | 25.3 | 61 | 94 | 77.6 |
|---|
| Year | 21.4 | 34.2 | 27.7 | 70.4 | 93.5 | 82 |
|---|
amounts to 1085 millimeters (42.7 inches) per year: it is therefore quite abundant. It ranges from 0 mm (0 in) in the driest months (January, February, December) to 285 mm (11.2 in) in the wettest one (August). Here is the average precipitation.
Moundou - Average precipitation| Month | Millimeters | Inches | Days |
|---|
| January | 0 | 0 | 0 |
|---|
| February | 0 | 0 | 1 |
|---|
| March | 5 | 0.2 | 2 |
|---|
| April | 40 | 1.6 | 5 |
|---|
| May | 90 | 3.5 | 9 |
|---|
| June | 150 | 5.9 | 12 |
|---|
| July | 260 | 10.2 | 15 |
|---|
| August | 285 | 11.2 | 19 |
|---|
| September | 200 | 7.9 | 13 |
|---|
| October | 55 | 2.2 | 7 |
|---|
| November | 2 | 0.1 | 2 |
|---|
| December | 0 | 0 | 0 |
|---|
| Year | 1085 | 42.7 | 85 |
|---|
There are on average around 2810
sunshine hours per year. Here are the average hours of sunshine per day.
Moundou - Sunshine hours| Month | Average | Total |
|---|
January | 9 | 280 | February | 9 | 250 | March | 8 | 250 | April | 8 | 235 | May | 8 | 240 | June | 7 | 210 | July | 6 | 185 | August | 5.5 | 170 | September | 6 | 185 | October | 7.5 | 235 | November | 9.5 | 280 | December | 9.5 | 290 | Year | 7.7 | 2810 |
Moundou - Weather by month
Based on the period 1991-2020
January is generally a warm to hot month. However, there are remarkable differences between night and day. The average temperature is of 25.5 °C (78 °F), with a minimum of 16.8 °C (62.2 °F) and a maximum of 34.2 °C (93.6 °F).

On the coldest nights of the month, the temperature usually drops to around 12.5 °C (55 °F).

On the warmest days of the month, the temperature usually reaches around 38.5 °C (101.5 °F). However, it reached 40.4 °C (104.7 °F) in January 2005.

Precipitation amounts to only 0 mm (0 in), so on average it never rains in the whole month.
The day lasts on average 11 hours and 40 minutes.

There are on average 9 hours of sunshine per day. So, the sun shines 77% of the time.
The average humidity is 21%. Hence, the air is normally dry.
The average wind speed is 13 kph (8 mph).
February is generally a very hot month. However, there are remarkable differences between night and day. The average temperature is of 28.8 °C (84 °F), with a minimum of 20.2 °C (68.4 °F) and a maximum of 37.4 °C (99.3 °F).
On the coldest nights of the month, the temperature usually drops to around 15 °C (59 °F).
On the warmest days of the month, the temperature usually reaches around 40.5 °C (105 °F). However, it reached 42 °C (107.6 °F) in February 2005.
Precipitation amounts to only 0 mm (0 in), so on average it never rains in the whole month.
The day lasts on average 11 hours and 55 minutes.
There are on average 9 hours of sunshine per day. So, the sun shines 74% of the time.
The average humidity is 20%. Hence, the air is normally dry.
The average wind speed is 13 kph (8 mph).
March is generally a very hot month. However, there are remarkable differences between night and day. The average temperature is of 31.6 °C (89 °F), with a minimum of 24 °C (75.2 °F) and a maximum of 39.3 °C (102.7 °F).
On the coldest nights, the temperature usually drops to around 18 °C (64.5 °F).
On the warmest days, the temperature usually reaches around 42 °C (108 °F). However, it reached 43.5 °C (110.3 °F) in March 2017.
Precipitation amounts to only 5 mm (0.2 in), distributed over 2 days.
The day lasts on average 12 hours and 5 minutes.
There are on average 8 hours of sunshine per day. So, the sun shines 66% of the time.
The average humidity is 23%. Hence, the air is normally dry.
The average wind speed is 12 kph (8 mph).
April, the hottest month of the year, is generally a scorchingly hot month. The average temperature is of 32.2 °C (90 °F), with a minimum of 25.8 °C (78.4 °F) and a maximum of 38.5 °C (101.3 °F).
On the coldest nights, the temperature usually drops to around 20.5 °C (69 °F).
On the warmest days, the temperature usually reaches around 41.5 °C (107 °F). However, it reached 44 °C (111.2 °F) in April 2010.
Precipitation amounts to 40 mm (1.6 in), distributed over 5 days.
The day lasts on average 12 hours and 20 minutes.
There are on average 8 hours of sunshine per day. So, the sun shines 63% of the time.
The average humidity is 39%.
The average wind speed is 12 kph (7 mph).
May is generally a very hot month. The average temperature is of 29.8 °C (86 °F), with a minimum of 24.5 °C (76 °F) and a maximum of 35.1 °C (95.2 °F).
On the coldest nights, the temperature usually drops to around 20.5 °C (68.5 °F).
On the warmest days, the temperature usually reaches around 40 °C (104.5 °F). However, it reached 43 °C (109.4 °F) in May 2000.
Precipitation amounts to 90 mm (3.5 in), distributed over 9 days.
The day lasts on average 12 hours and 30 minutes.
There are on average 8 hours of sunshine per day. So, the sun shines 62% of the time.
The average humidity is 57%.
The average wind speed is 12 kph (7 mph).
June is generally a warm to hot month. The average temperature is of 27.3 °C (81 °F), with a minimum of 22.5 °C (72.5 °F) and a maximum of 32.2 °C (89.9 °F).
On the coldest nights, the temperature usually drops to around 19.5 °C (66.5 °F).
On the warmest days, the temperature usually reaches around 37 °C (98.5 °F). However, it reached 39.4 °C (102.9 °F) in June 2019.
Precipitation amounts to 150 mm (5.9 in), distributed over 12 days.
The day lasts on average 12 hours and 35 minutes.
There are on average 7 hours of sunshine per day. So, the sun shines 56% of the time.
The average humidity is 70%.
The average wind speed is 10 kph (6 mph).
July is generally a warm to hot, muggy month. The average temperature is of 26.3 °C (79 °F), with a minimum of 21.8 °C (71.3 °F) and a maximum of 30.8 °C (87.4 °F).
On the coldest nights of the month, the temperature usually drops to around 19.5 °C (67 °F).
On the warmest days of the month, the temperature usually reaches around 35 °C (95 °F). However, it reached 42 °C (107.6 °F) in July 1993.
Precipitation amounts to 260 mm (10.2 in), distributed over 15 days.
The day lasts on average 12 hours and 35 minutes.
There are on average 6 hours of sunshine per day. So, the sun shines 47% of the time.
The average humidity is 75%. Hence, the air is normally humid.
The average wind speed is 10 kph (6 mph).
August is generally a warm to hot, muggy month. The average temperature is of 25.8 °C (78 °F), with a minimum of 21.7 °C (71 °F) and a maximum of 29.8 °C (85.7 °F).
On the coldest nights of the month, the temperature usually drops to around 19 °C (66.5 °F).
On the warmest days of the month, the temperature usually reaches around 34 °C (93 °F). However, it reached 39 °C (102.2 °F) in August 2008.
Precipitation amounts to 285 mm (11.2 in), distributed over 19 days.
The day lasts on average 12 hours and 25 minutes.
There are on average 5.5 hours of sunshine per day. So, the sun shines 44% of the time.
The average humidity is 78%. Hence, the air is normally humid.
The average wind speed is 9 kph (5 mph).
September is generally a warm to hot, muggy month. The average temperature is of 26.2 °C (79 °F), with a minimum of 21.7 °C (71.1 °F) and a maximum of 30.7 °C (87.2 °F).
On the coldest nights, the temperature usually drops to around 19.5 °C (67 °F).
On the warmest days, the temperature usually reaches around 34.5 °C (94 °F). However, it reached 39.5 °C (103.1 °F) in September 2008.
Precipitation amounts to 200 mm (7.9 in), distributed over 13 days.
The day lasts on average 12 hours and 10 minutes.
There are on average 6 hours of sunshine per day. So, the sun shines 51% of the time.
The average humidity is 76%. Hence, the air is normally humid.
The average wind speed is 7 kph (5 mph).
October is generally a warm to hot month. The average temperature is of 27.5 °C (82 °F), with a minimum of 22.1 °C (71.7 °F) and a maximum of 33 °C (91.4 °F).
On the coldest nights, the temperature usually drops to around 19 °C (66.5 °F).
On the warmest days, the temperature usually reaches around 36.5 °C (97.5 °F). However, it reached 41 °C (105.8 °F) in October 2018.
Precipitation amounts to 55 mm (2.2 in), distributed over 7 days.
The day lasts on average 11 hours and 55 minutes.
There are on average 7.5 hours of sunshine per day. So, the sun shines 64% of the time.
The average humidity is 65%.
The average wind speed is 8 kph (5 mph).
November is generally a warm to hot month. However, there are remarkable differences between night and day. The average temperature is of 27.1 °C (81 °F), with a minimum of 18.9 °C (66.1 °F) and a maximum of 35.2 °C (95.4 °F).
On the coldest nights, the temperature usually drops to around 14 °C (57.5 °F).
On the warmest days, the temperature usually reaches around 37.5 °C (99.5 °F). However, it reached 39 °C (102.2 °F) in November 2008.
Precipitation amounts to only 2 mm (0.1 in), distributed over 2 days.
The day lasts on average 11 hours and 40 minutes.
There are on average 9.5 hours of sunshine per day. So, the sun shines 81% of the time.
The average humidity is 40%.
The average wind speed is 9 kph (6 mph).
December, the least warm month of the year, is generally a warm to hot month. However, there are remarkable differences between night and day. The average temperature is of 25.3 °C (78 °F), with a minimum of 16.2 °C (61.2 °F) and a maximum of 34.4 °C (94 °F).
On the coldest nights of the month, the temperature usually drops to around 12 °C (54 °F).
On the warmest days of the month, the temperature usually reaches around 37 °C (99 °F). However, it reached 39 °C (102.2 °F) in December 2016.
Precipitation amounts to only 0 mm (0 in), so on average it never rains in the whole month.
The day lasts on average 11 hours and 35 minutes.
There are on average 9.5 hours of sunshine per day. So, the sun shines 81% of the time.
The average humidity is 27%. Hence, the air is normally dry.
The average wind speed is 11 kph (7 mph).