Select units of measurement for the temperature and rainfall tables (metric or imperial).
Average weather, temperature, rainfall, sunshine hours

In Ganja, the climate is
slightly continental and arid, with quite cold winters and hot summers.
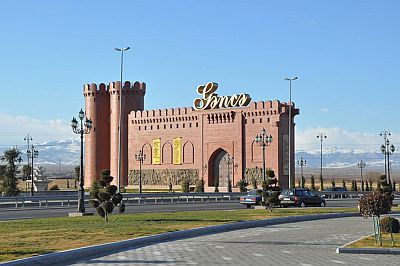
Ganja (or Gəncə) is a city of 335,000 inhabitants, located in western Azerbaijan, on the northern slopes of the Lesser Caucasus, and at 40 degrees north latitude. The altitude of the city varies from 300 to 580 meters (985 and 1,900 feet). The center is at 400 meters (1,300 ft).
To the north flows the Kura River, which originates from Georgia, where it has already passed through the city of Tbilisi.
 Precipitation
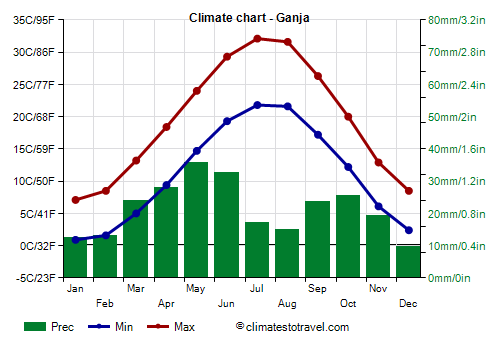
 is scarce, since it amounts to 255 millimeters (9 inches) per year. The driest periods are winter and the central part of summer.
Winter, from December to February, is quite cold, although there can be mild periods, during which the temperature reaches or exceeds 15 °C (59 °F). The average temperature in January is around 4 °C (39 °F).
Snowfall is quite frequent, although it is not abundant due to the low level of precipitation.
In addition, cold spells can occur. Typically, it takes several years to see temperatures drop to -10 °C (14 °F) or below. Occasionally, in the past, it has dropped to around -15 °C (5 °F). The coldest record is -17.8 °C (0 °F), set in January 1935.
In recent decades, the temperature has dropped to -12 °C (10.4 °F) in February 1993, -10.4 °C (13.3 °F) in January 2008 and -10 °C (14 °F) in February 2014.
In January 2008, the monthly daily average was -2.8 °C (27 °F).
Summer, from June to August, is hot and sunny. Thunderstorms are quite frequent in June (though not strong), and then decrease a bit in July and August. The latter are the hottest months, with an average of about 26.5/27 °C (79.5/80.5 °F).
There can be very hot periods, during which the temperature reaches or exceeds 35 °C (95 °F).
The highest record is 42 °C (107.6 °F), set in July 2010. In August 2021, the average maximum was 34.7 °C (94.5 °F).
Ganja - Climate data
In Ganja, the
average temperature of the coldest month (January) is of
4 °C, that of the warmest month (July) is of
27 °C. Here are the average temperatures.
Ganja - Average temperatures (1991-2020) |
| Month | Min | Max | Mean |
|---|
| January | 0.9 | 7.1 | 4 |
|---|
| February | 1.6 | 8.5 | 5 |
|---|
| March | 5 | 13.2 | 9.1 |
|---|
| April | 9.4 | 18.4 | 13.9 |
|---|
| May | 14.7 | 24 | 19.4 |
|---|
| June | 19.3 | 29.3 | 24.3 |
|---|
| July | 21.8 | 32.1 | 27 |
|---|
| August | 21.6 | 31.6 | 26.6 |
|---|
| September | 17.2 | 26.3 | 21.8 |
|---|
| October | 12.2 | 20 | 16.1 |
|---|
| November | 6.1 | 12.9 | 9.5 |
|---|
| December | 2.4 | 8.5 | 5.4 |
|---|
| Year | 11.1 | 19.4 | 15.2 |
|---|
amounts to
255 millimeters per year: it is therefore scarce. It ranges from
9.7 millimeters in the driest month (December) to
35.6 millimeters in the wettest one (May). Here is the average precipitation.
Ganja - Average precipitation| Month | Days |
|---|
| January | 12 | 4 |
|---|
| February | 13 | 5 |
|---|
| March | 24 | 5 |
|---|
| April | 28 | 6 |
|---|
| May | 36 | 9 |
|---|
| June | 33 | 7 |
|---|
| July | 17 | 3 |
|---|
| August | 15 | 4 |
|---|
| September | 24 | 3 |
|---|
| October | 25 | 6 |
|---|
| November | 19 | 3 |
|---|
| December | 10 | 4 |
|---|
| Year | 255 | 59 |
|---|
There are on average around 2200
sunshine hours per year. Here are the average hours of sunshine per day.
Ganja - Sunshine hours| Month | Average | Total |
|---|
| January | 4 | 120 |
|---|
| February | 4 | 115 |
|---|
| March | 4.5 | 140 |
|---|
| April | 6 | 180 |
|---|
| May | 7.5 | 230 |
|---|
| June | 9 | 265 |
|---|
| July | 9 | 280 |
|---|
| August | 8 | 250 |
|---|
| September | 7 | 210 |
|---|
| October | 5.5 | 170 |
|---|
| November | 4 | 125 |
|---|
| December | 3.5 | 115 |
|---|
| Year | 6 | 2200 |
|---|